What this report shows
Track how your sales are trending over time. Compare current performance against previous periods and see daily patterns across different dimensions.Filters
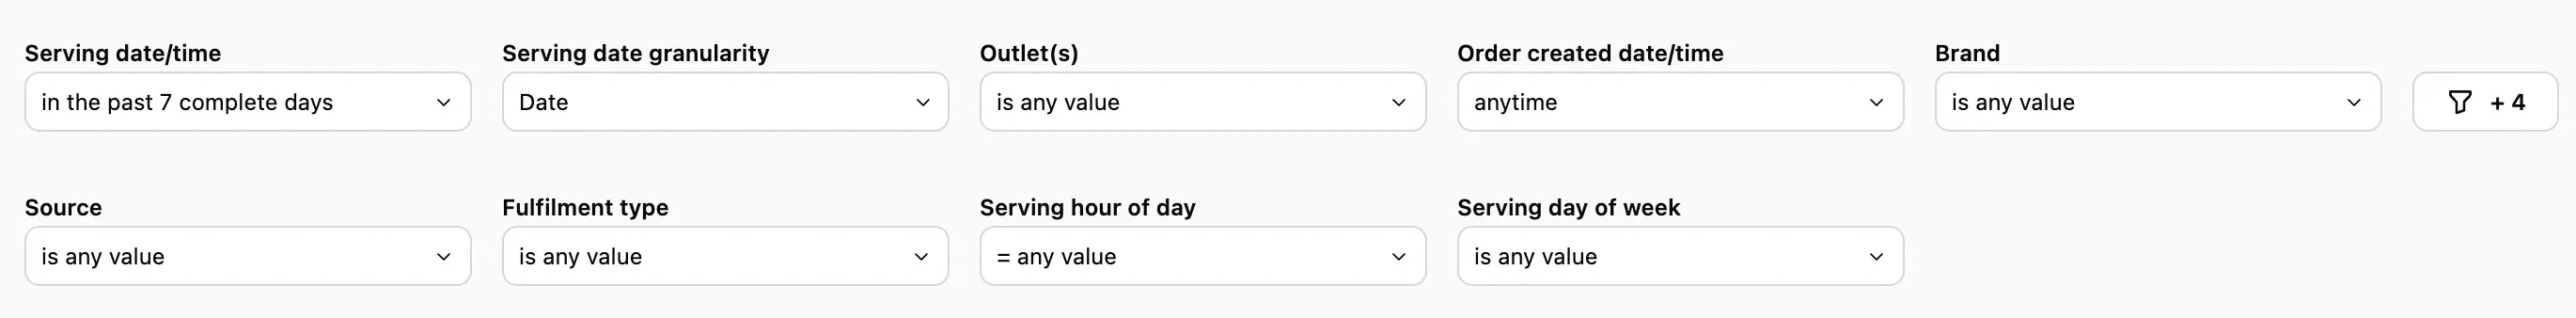
- Serving date/time — When orders were fulfilled. Defaults to the past 7 complete days.
- Serving date granularity — Group data by date, week, month, quarter, or year.
- Outlet(s) — Filter by one or multiple outlets.
- Order created date/time — When the order was created.
- Brand — Filter by brand.
- Source — Where orders came from (POS, scan to order, kiosk, etc.)
- Fulfilment type — Dine-in, pickup, or delivery.
- Serving hour of day — Filter by specific hours.
- Serving day of week — Filter by specific days.
Sections
Month-to-date sales
Current month’s net sales compared to:- Last MTD — Same period last month
- Last year MTD — Same period last year
Week-to-date sales
Current week’s net sales compared to:- Last WTD — Same period last week
- 4 weeks ago WTD — Same period 4 weeks ago

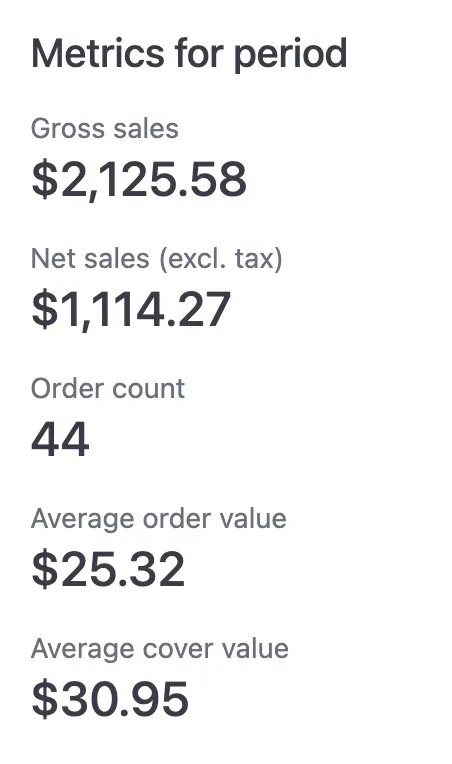
Metrics for period
Summary metrics for your selected date range:- Gross sales — Total sales before discounts and tax
- Net sales (excl. tax) — Sales after discounts, excluding tax
- Order count — Total number of orders
- Average order value — Net sales divided by order count
- Average cover value — Net sales divided by total covers
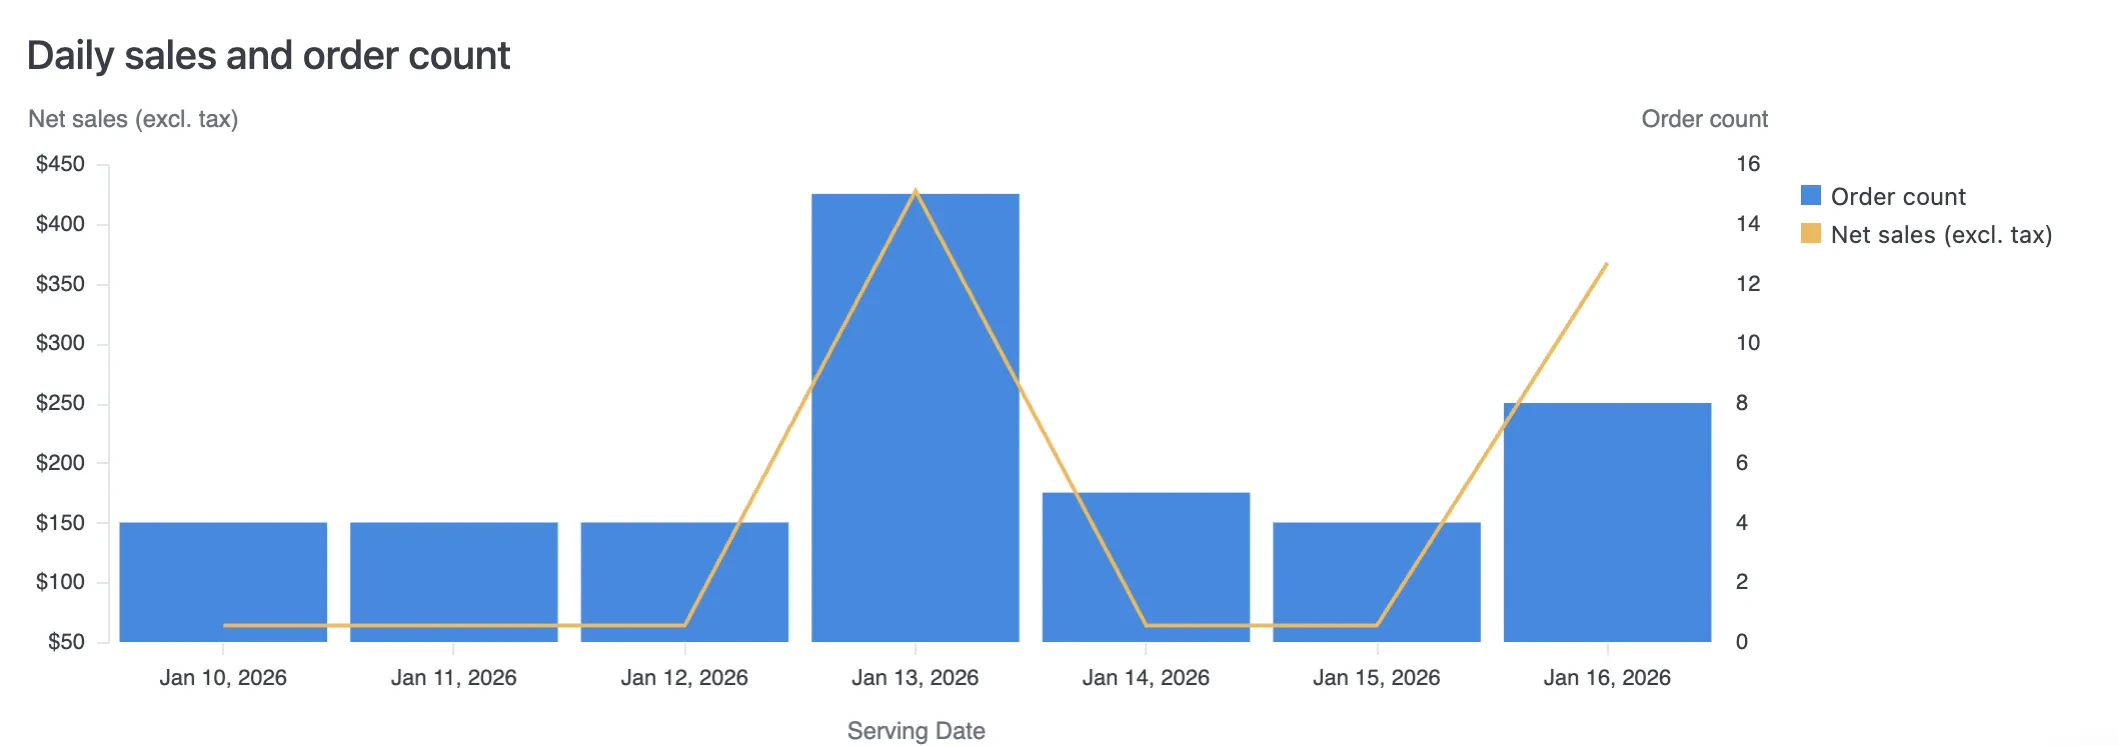
Daily sales and order count
A combined chart showing:- Order count (blue bars) — Number of orders per day
- Net sales (orange line) — Net sales excluding tax per day
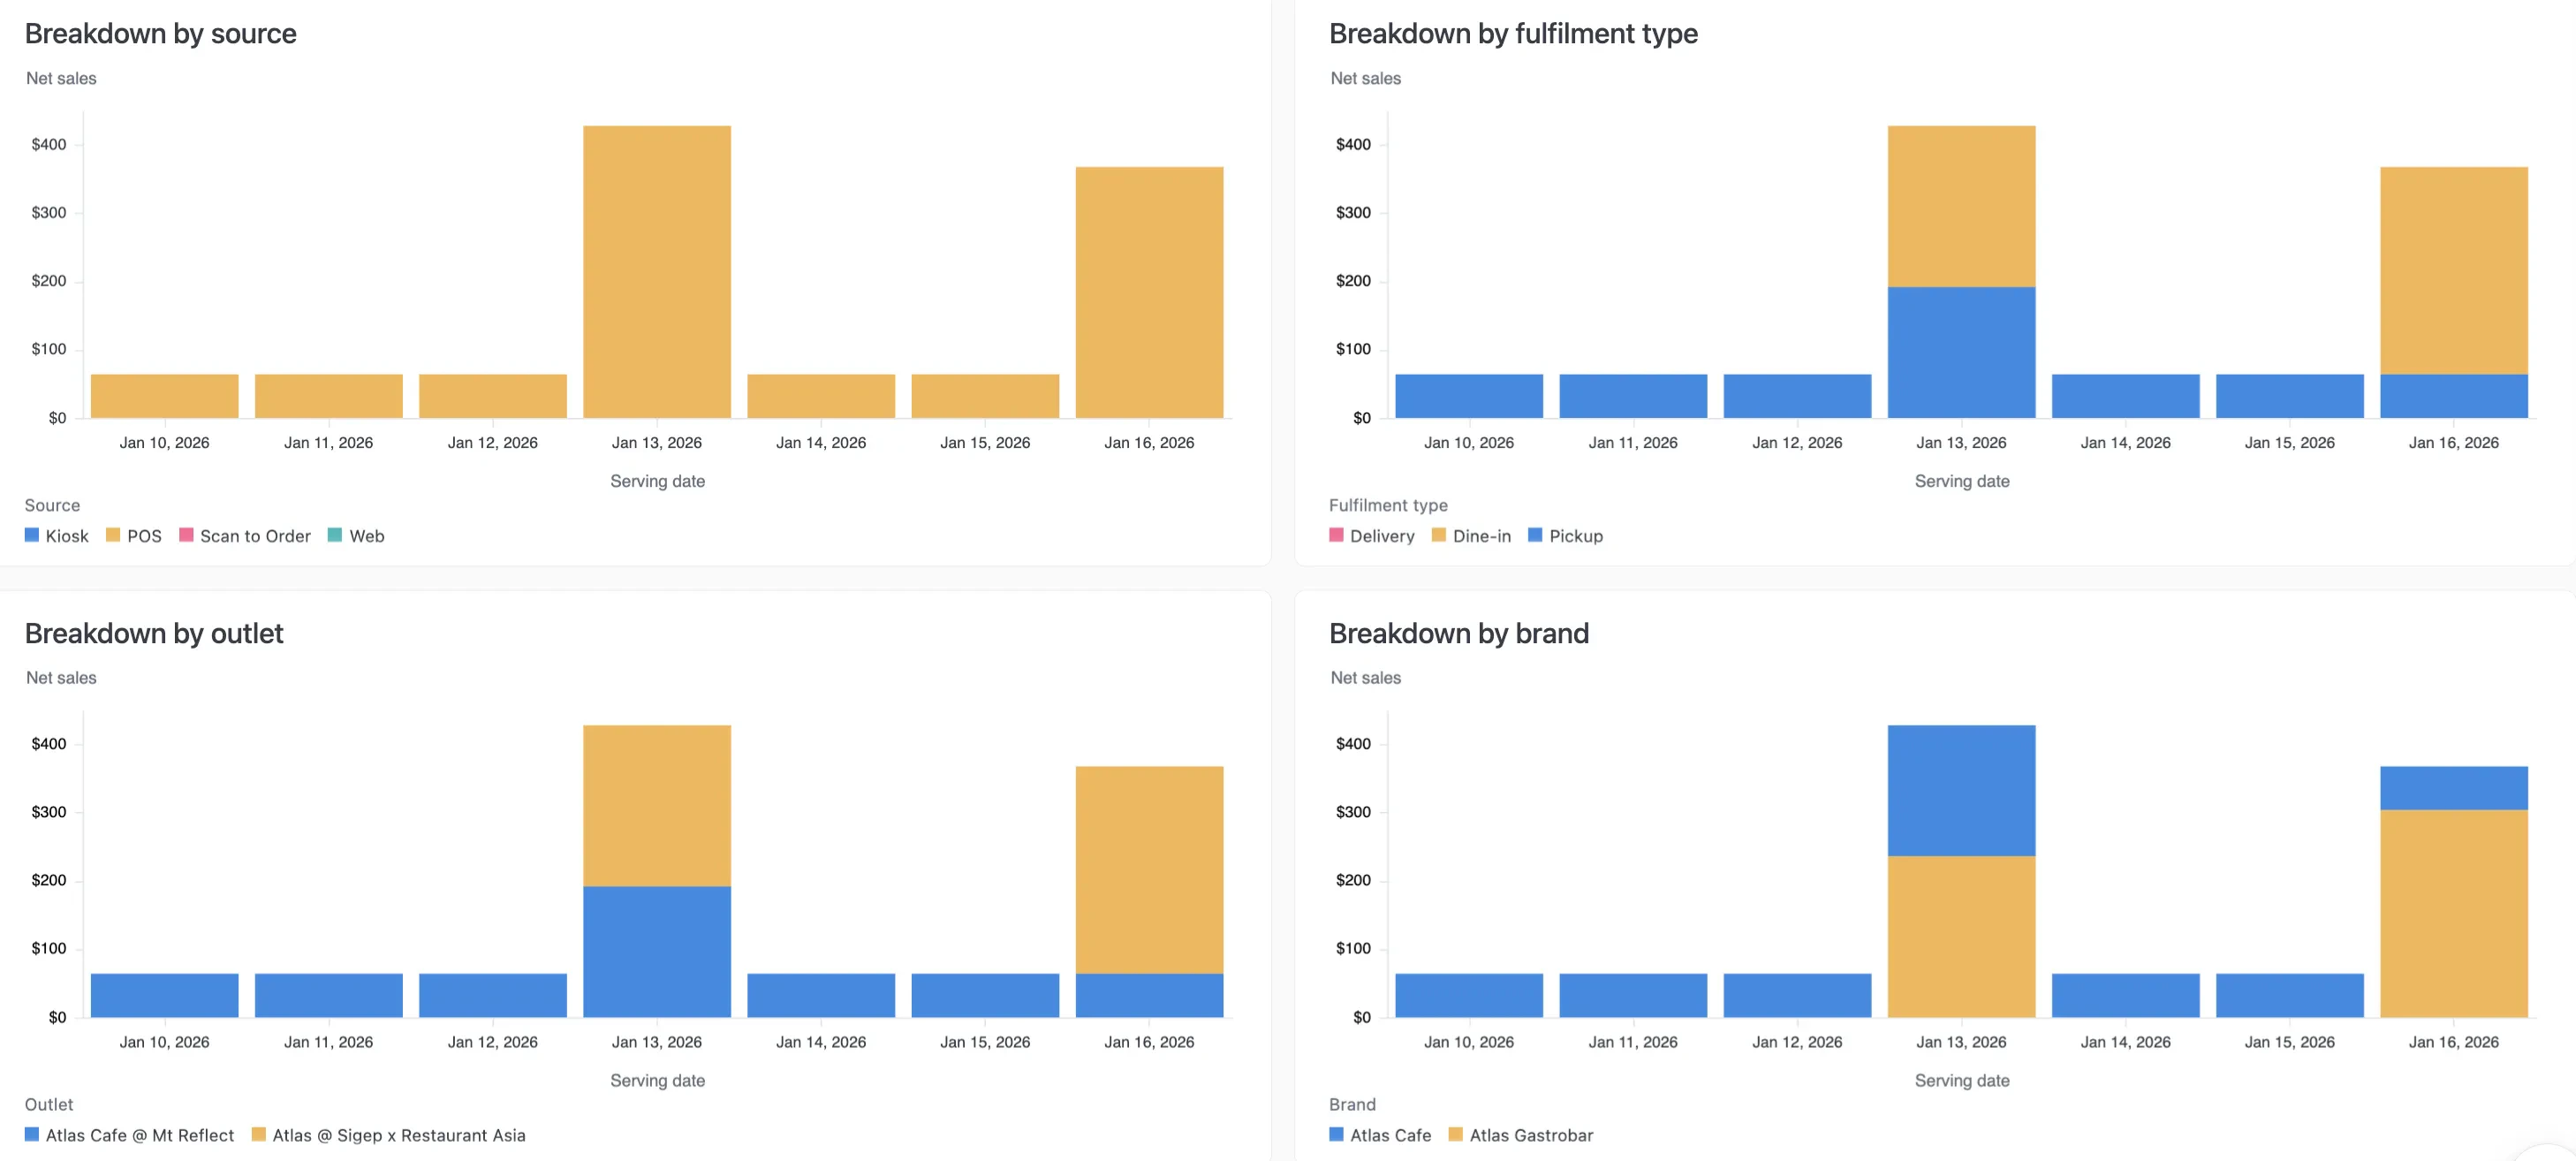
Breakdown by source
Daily net sales stacked by order source (e.g., Kiosk, POS, Scan to Order, Web).Breakdown by fulfilment type
Daily net sales stacked by fulfilment type (Delivery, Dine-in, Pickup).Breakdown by outlet
Daily net sales stacked by outlet. Useful for comparing location performance over time.Breakdown by brand
Daily net sales stacked by brand. Useful for multi-brand operators.