What this report shows
A comprehensive breakdown of your sales performance. Track net sales, payment discrepancies, discounts, and see how sales split across outlets, brands, fulfilment types, and product categories.Filters
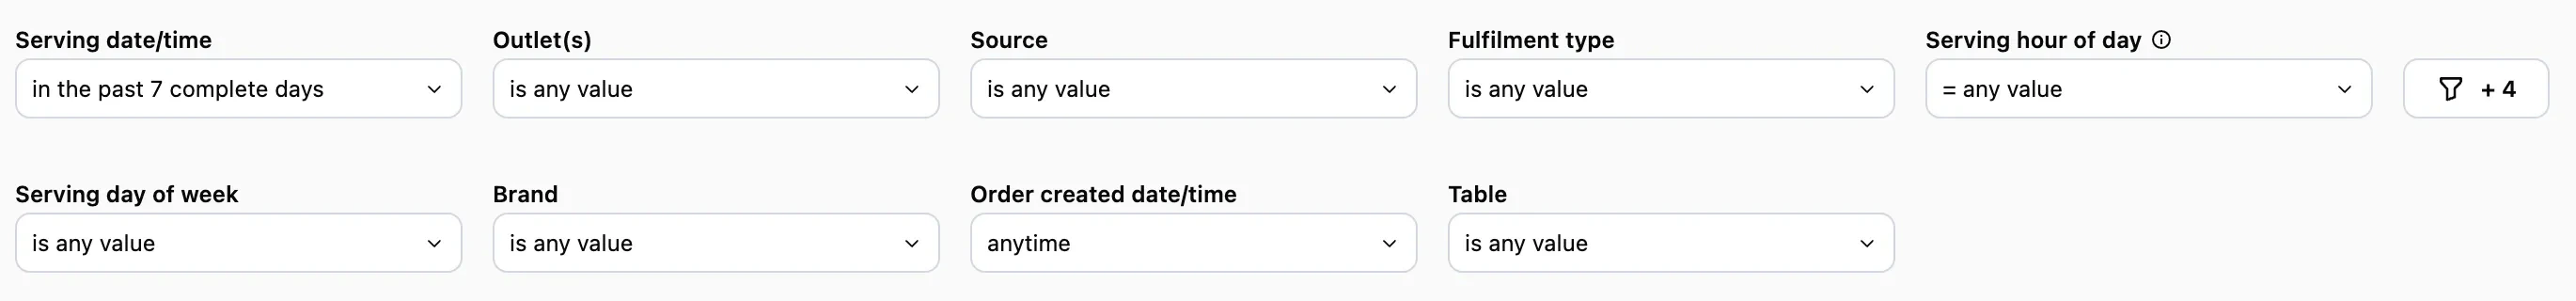
- Serving date/time — When orders were fulfilled. Defaults to the past 7 days.
- Outlet(s) — Filter by one or multiple outlets. Supports wildcard search (e.g., “contains atlas”).
- Source — Where orders came from (POS, scan to order, kiosk, etc.)
- Fulfilment type — Dine-in, pickup, or delivery
- Serving hour of day — Filter by specific hours
- Serving day of week — Filter by specific days
- Brand — Filter by brand if you operate multiple brands
- Order created date/time — When the order was created (different from serving time)
Sections
Key metrics
At-a-glance performance indicators: net sales, total covers, order count, average cover value, and average order value. Hover over the info icon next to each metric to see its definition.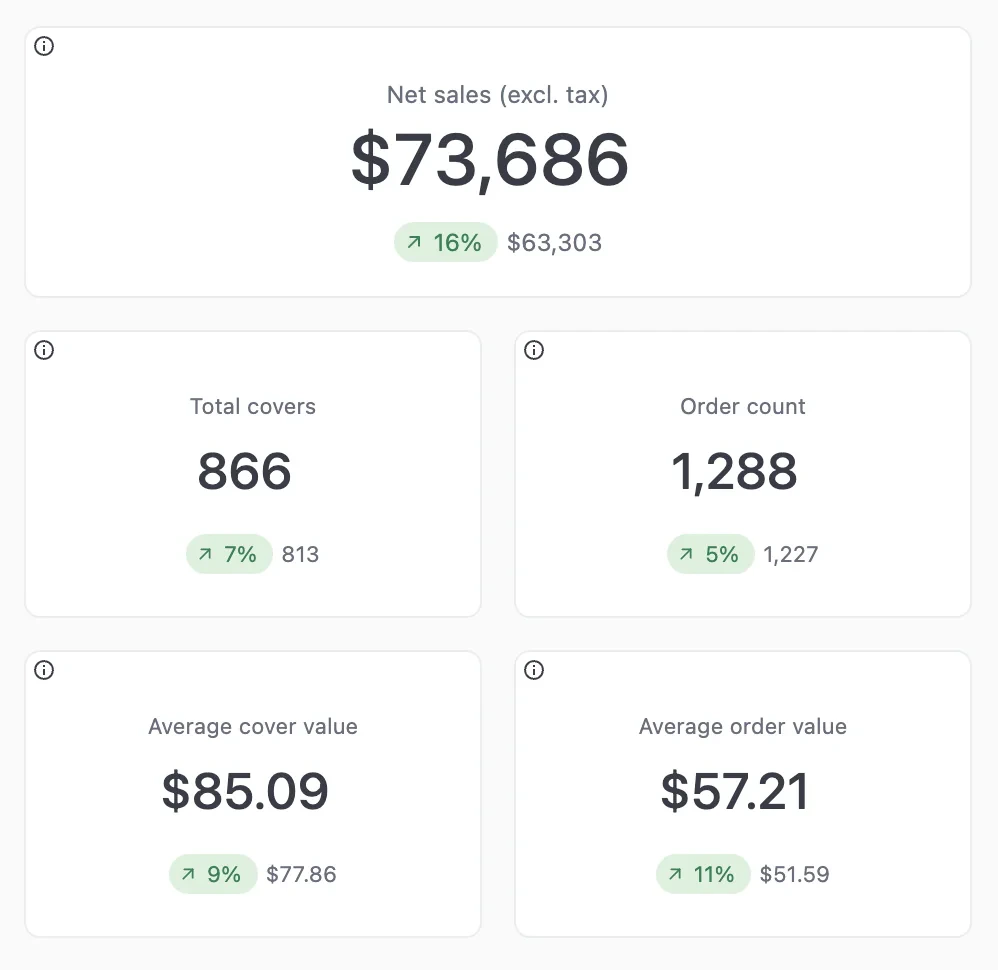
Sales summary
Financial breakdown from gross sales to final payments. Shows gross sales, discounts, net sales, tax, service charges, and expected payment.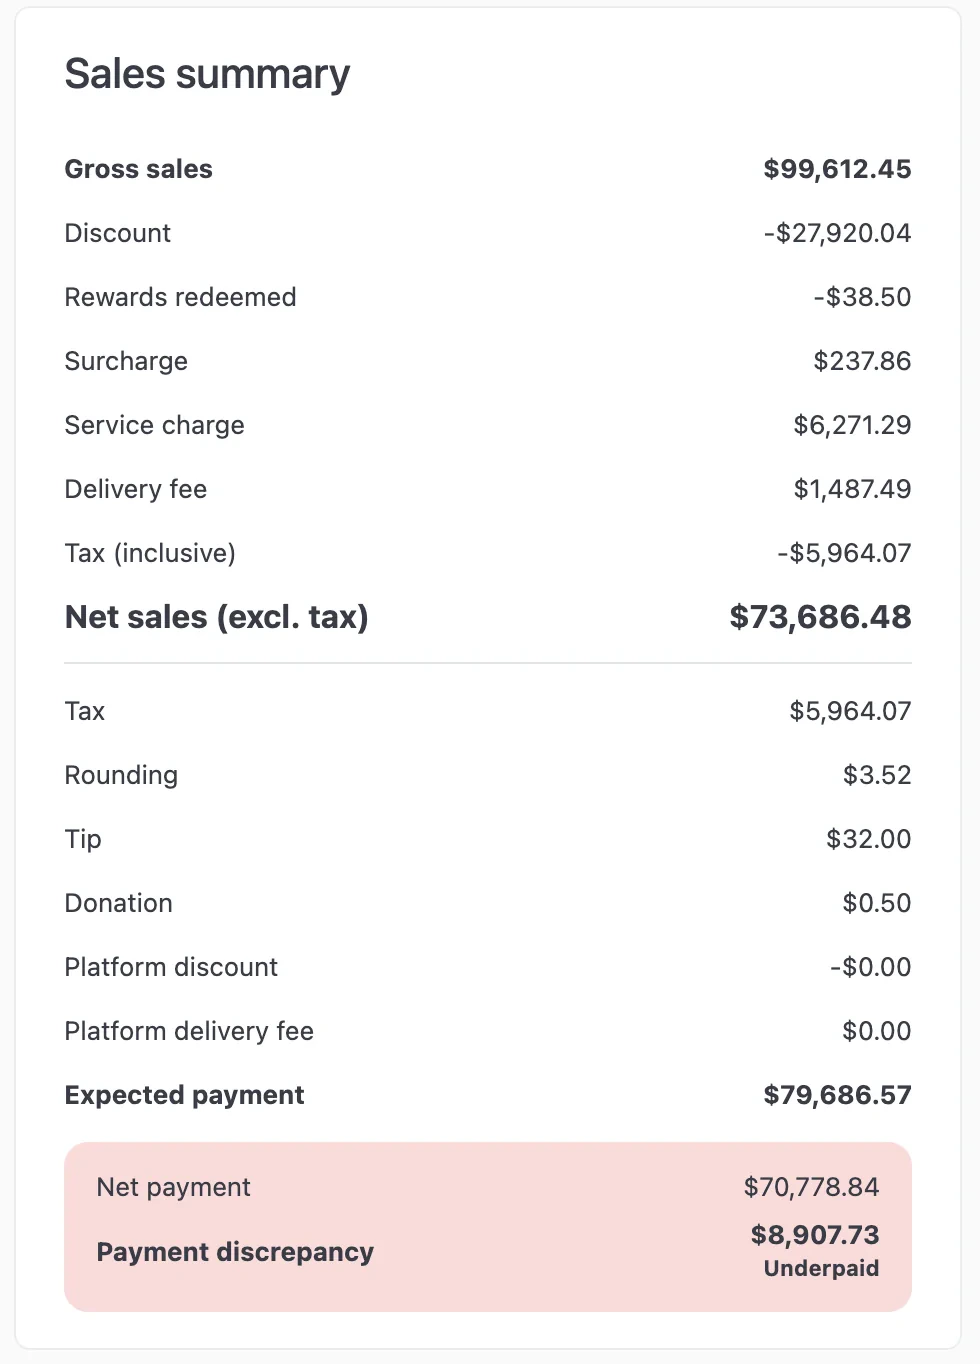
AI-generated insights
Automatically identifies trends, patterns, and notable changes in your sales data.Net sales charts
Three charts showing net sales broken down by:- Day — Daily sales by fulfilment type
- Day of week — Which days perform best
- Hour of day — Peak and off-peak hours
Payment type summary
Breakdown of payment methods used, split into integrated payments (processed through Atlas) and manual payments.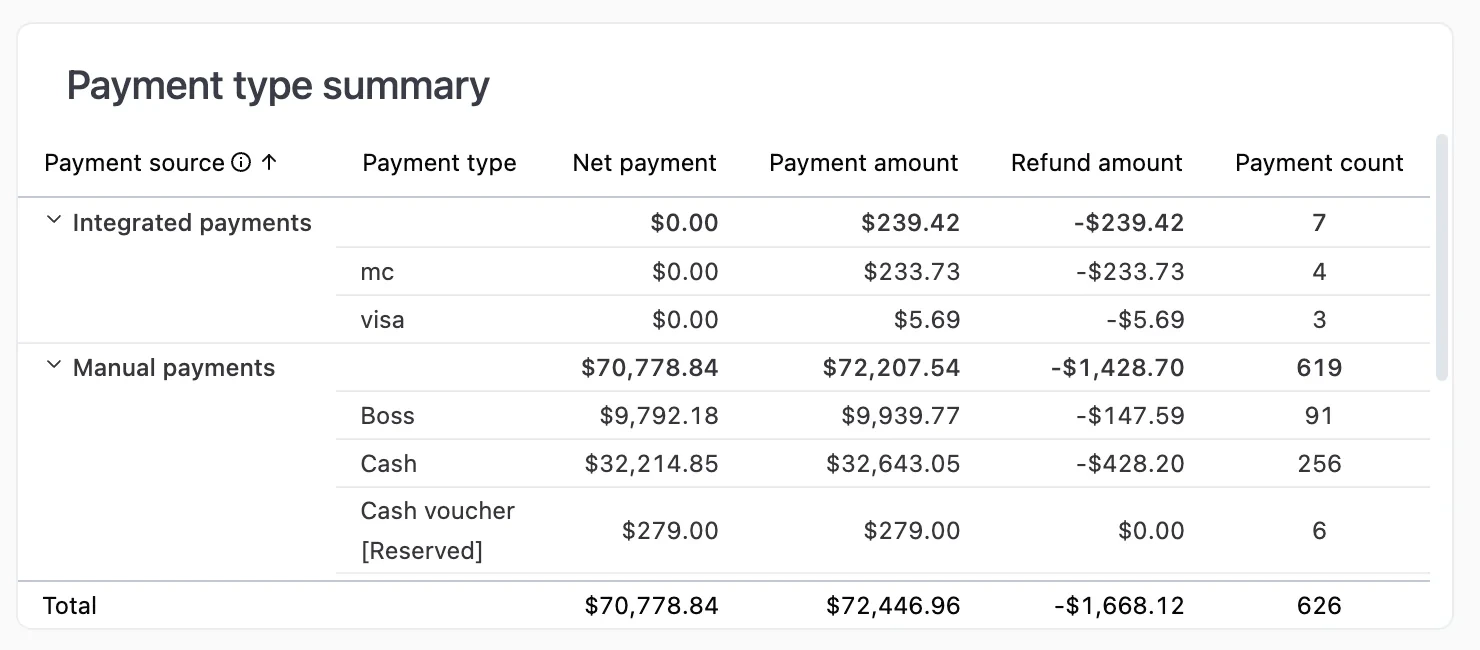
Outlet summary
Compare sales performance across your outlets: gross sales, net sales, order count, and average order value per location.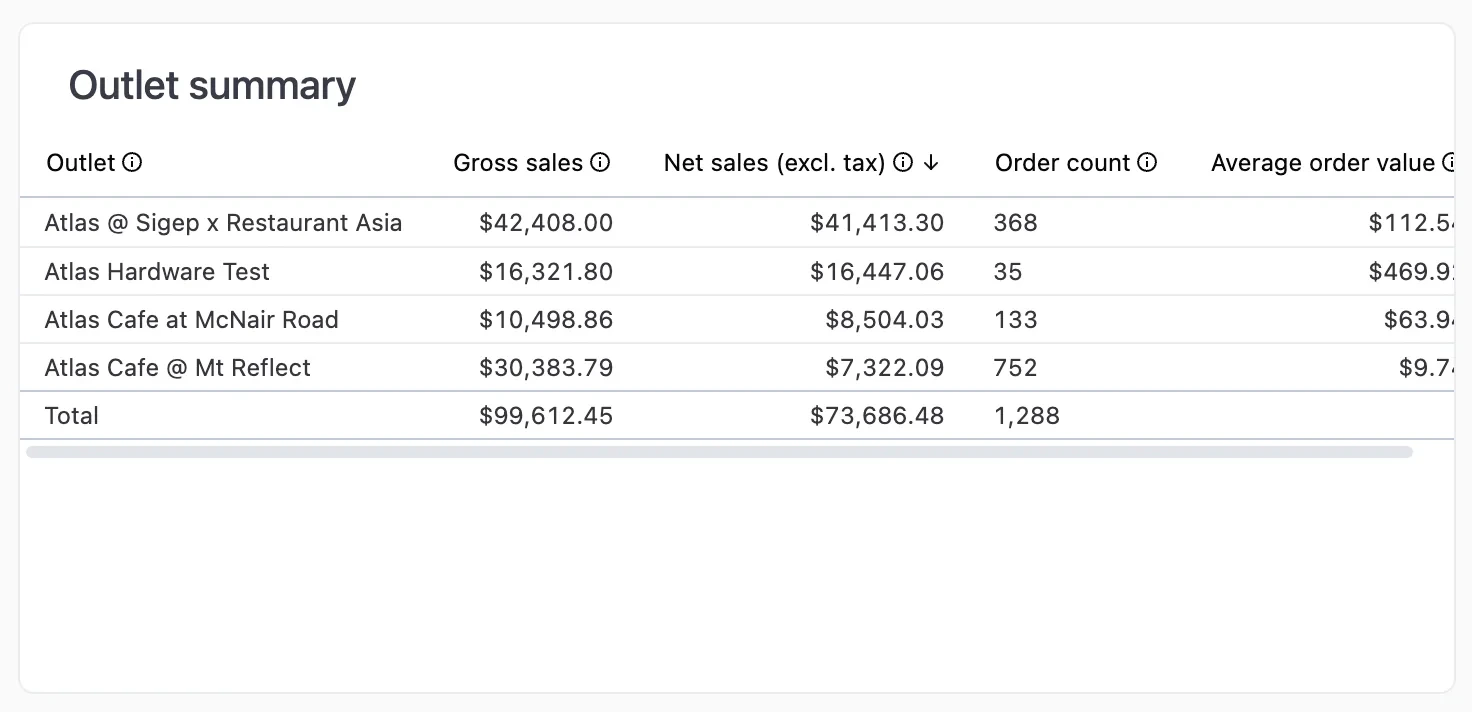
Brand summary
Sales performance by brand. Useful for multi-brand operators.Discount summary
Track promo code usage and total discount amounts.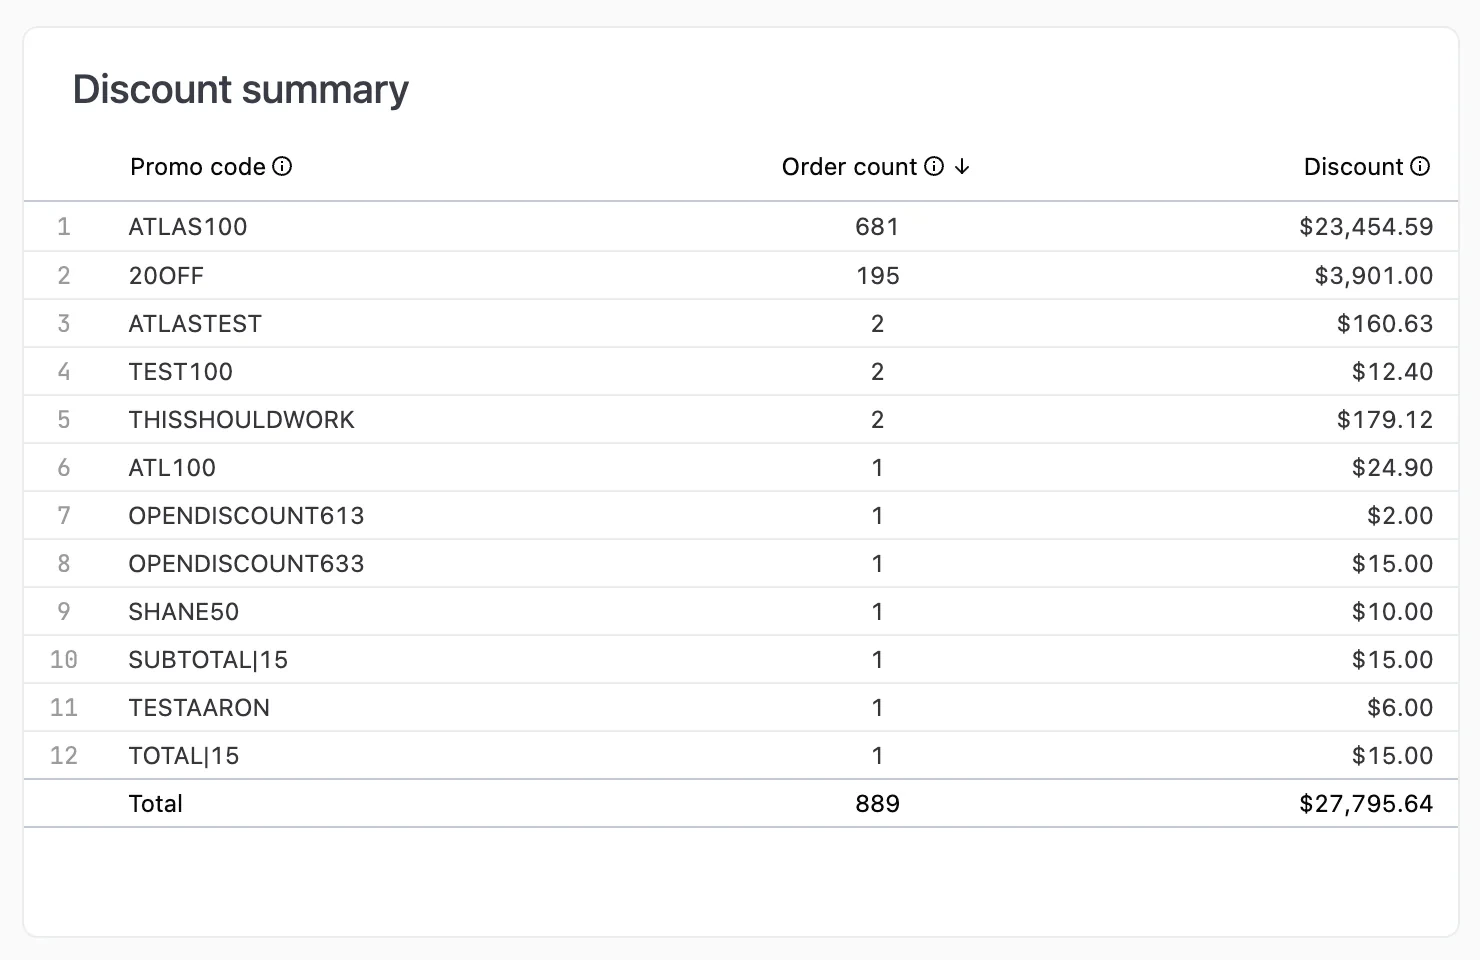
Fulfilment type summary
Sales breakdown by how orders were fulfilled (dine-in, pickup, delivery).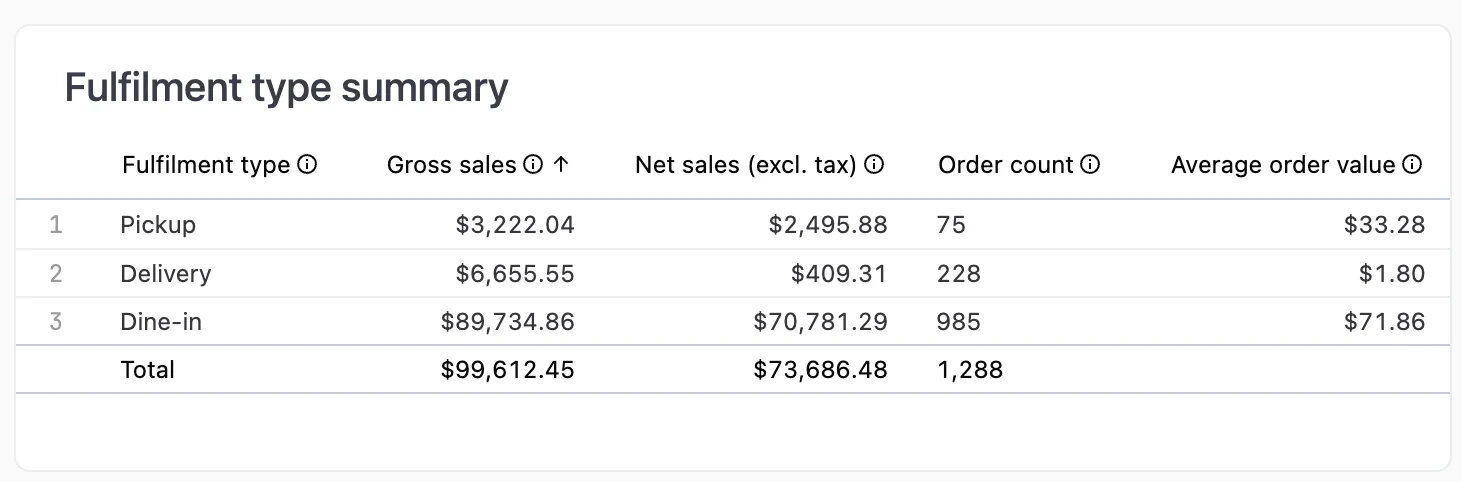
Source summary
Sales breakdown by order source (POS, scan to order, web, delivery platforms, etc.)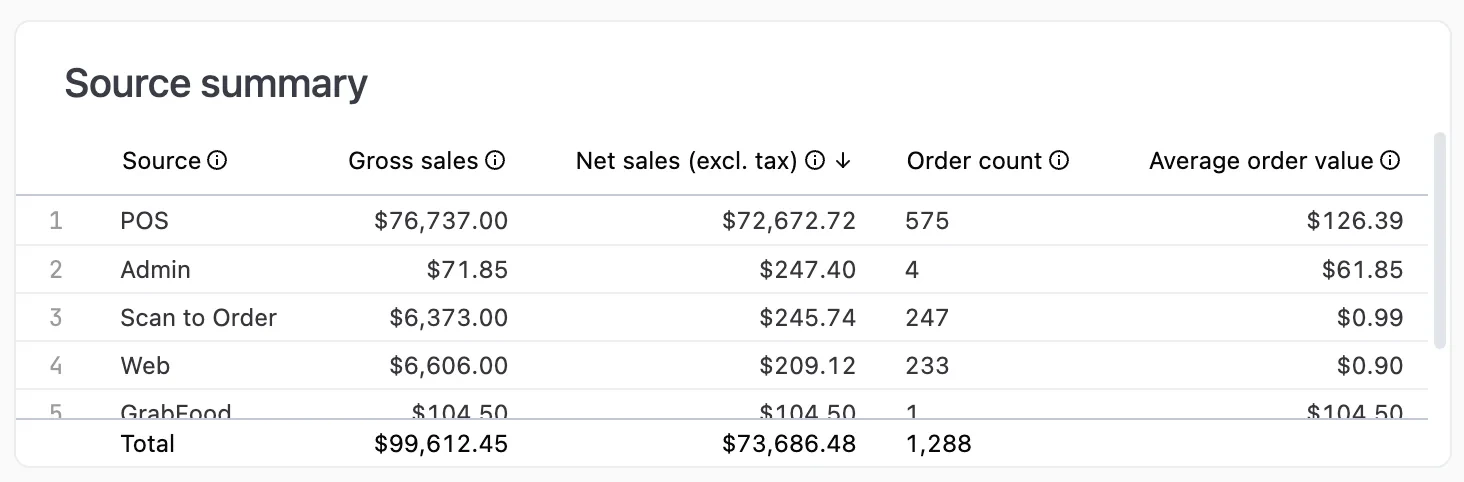
Customer type summary
Sales breakdown by customer type (Member, Guest, or unknown).Loyalty redemption summary
Compare orders with and without loyalty reward redemptions. Click any row to drill into individual redemption details.Item category summary
Product sales organised by reporting category. Click on any item to see modifier breakdowns.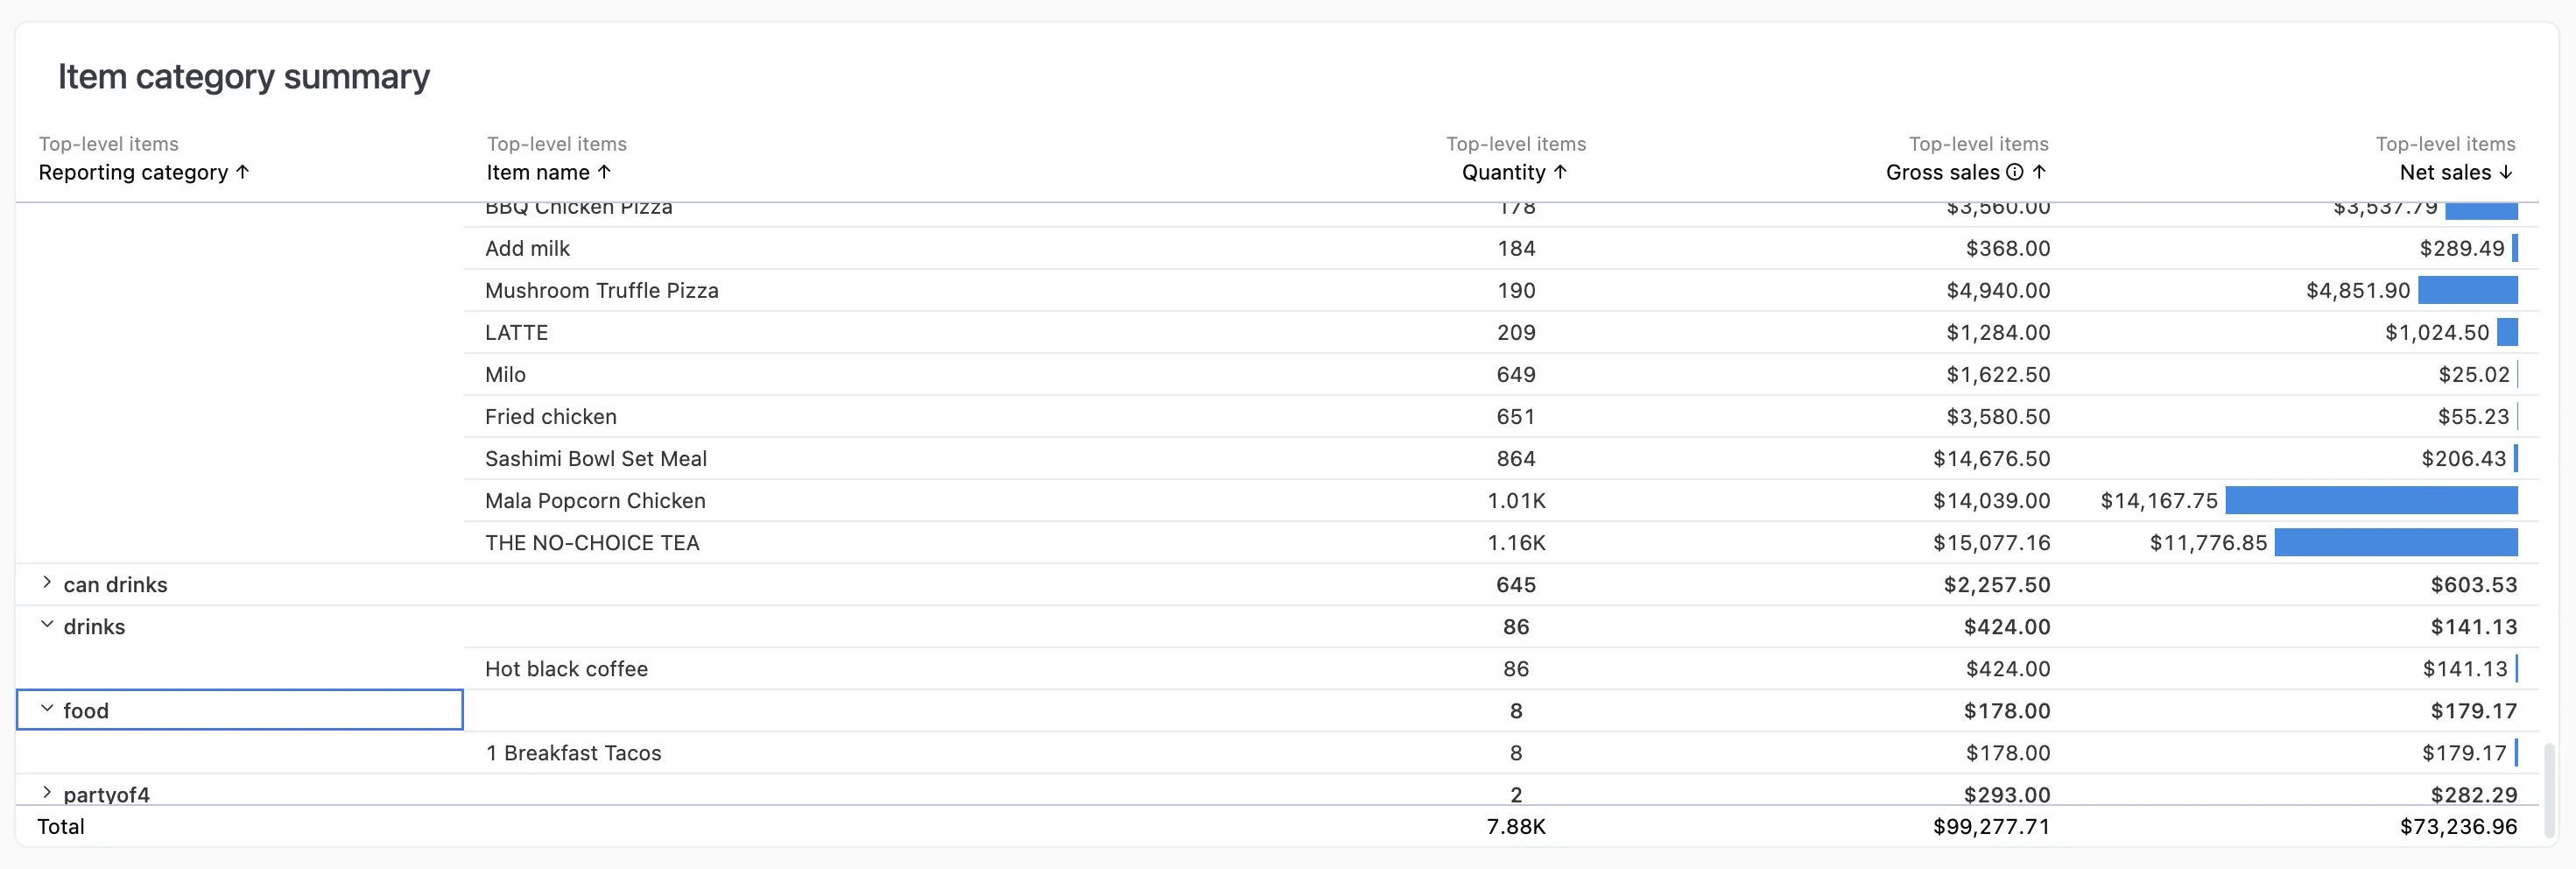
To set up reporting categories, edit your product on the Products page and set its Reporting category.