New vs legacy reports
Reports powered by Omni have replaced legacy versions with more features like scheduled deliveries and alerts. Legacy reports are marked LEGACY and will be removed by 1 June 2026. If you see different numbers between a new and legacy report for the same data, contact support at hello@atlas.kitchen.Accessing reports
Go to Reports in the Atlas Merchant Portal sidebar. You’ll see a directory of all available reports organised by category.
Filtering reports
Most reports have filters at the top to narrow down your data. Common filters include date range, outlet, and shift. Adjust these to see the data you need.Exporting and downloading
Analytics reports
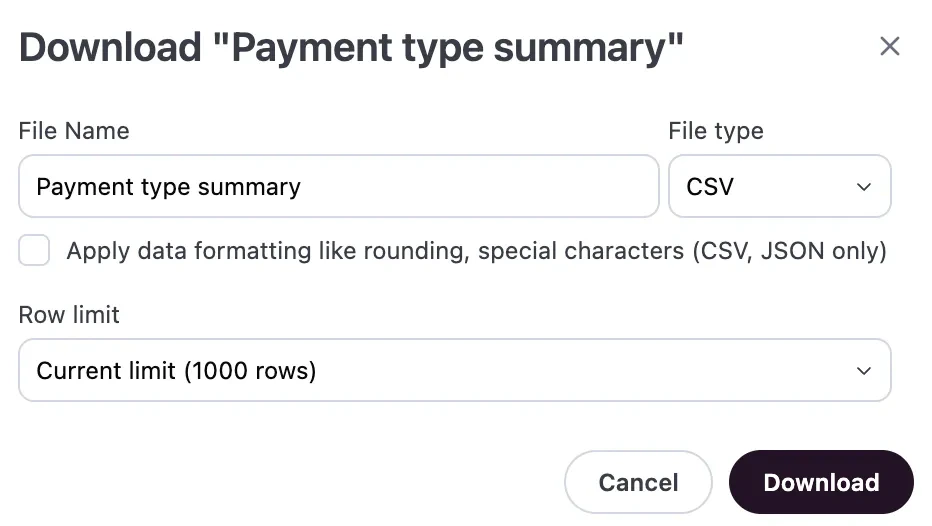
- Single tile: Click the three-dot menu (⋯) on any chart or table
- Entire dashboard: Click the download icon at the bottom right of the report
Downloads respect all active filters. Apply filters before downloading to export only the data you need.
Legacy reports
Most tiles have a download icon to export that section’s data.AI assistant
Only available for analytics reports.
- Dashboard assistant
- Follow-up on a tile
Click the AI icon in the bottom right corner to open the dashboard assistant. Select a chart or table, then ask questions about that data.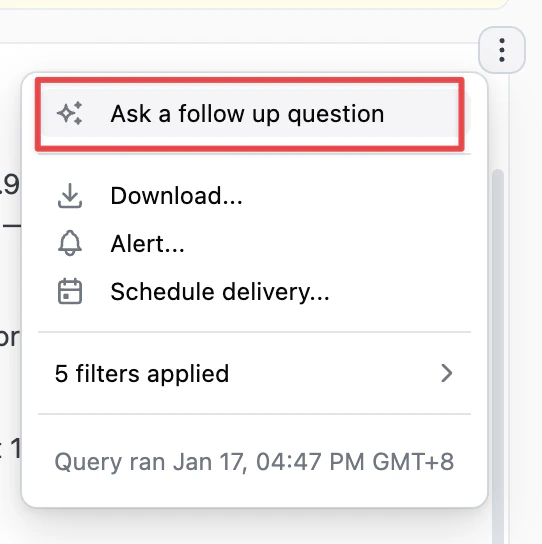
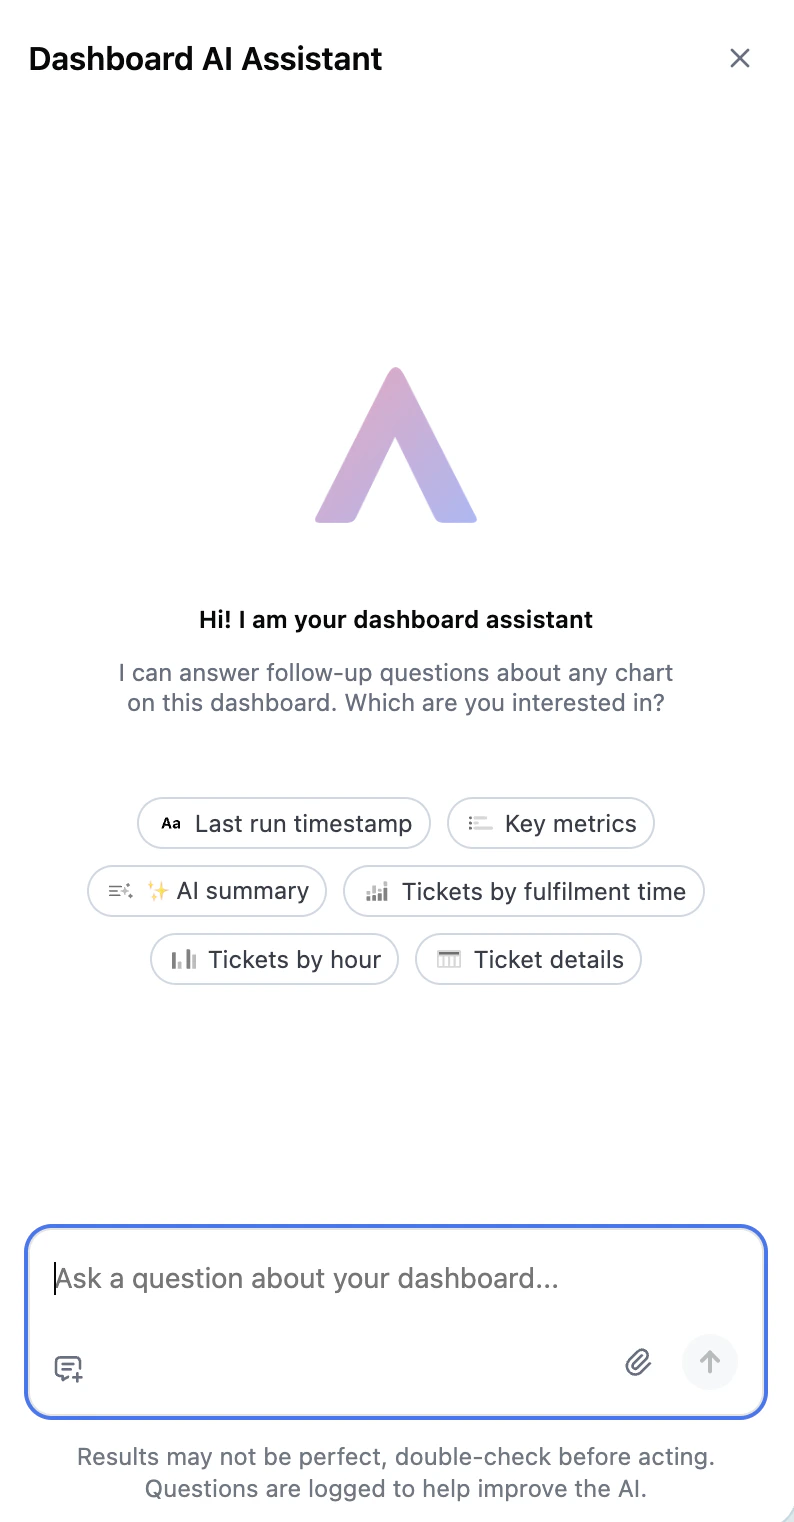
AI results may not be perfect. Double-check before acting on insights.
Scheduled deliveries and alerts
Only available for analytics reports.
- Schedules — Deliver reports at specified frequencies (e.g., daily, weekly)
- Alerts — Deliver reports only when specific conditions are met