What this report shows
Product sales performance across your menu. See which items drive revenue vs volume, compare categories, and drill into modifier-level details. The report is organized into three tabs:- Product mix — Overview with AI insights, charts, and category breakdowns.
- Product details — Detailed product-level data.
- Modifier groups — Modifier group choices and performance across your menu.
Data refreshes hourly. Last refresh time appears at the top.
Filters
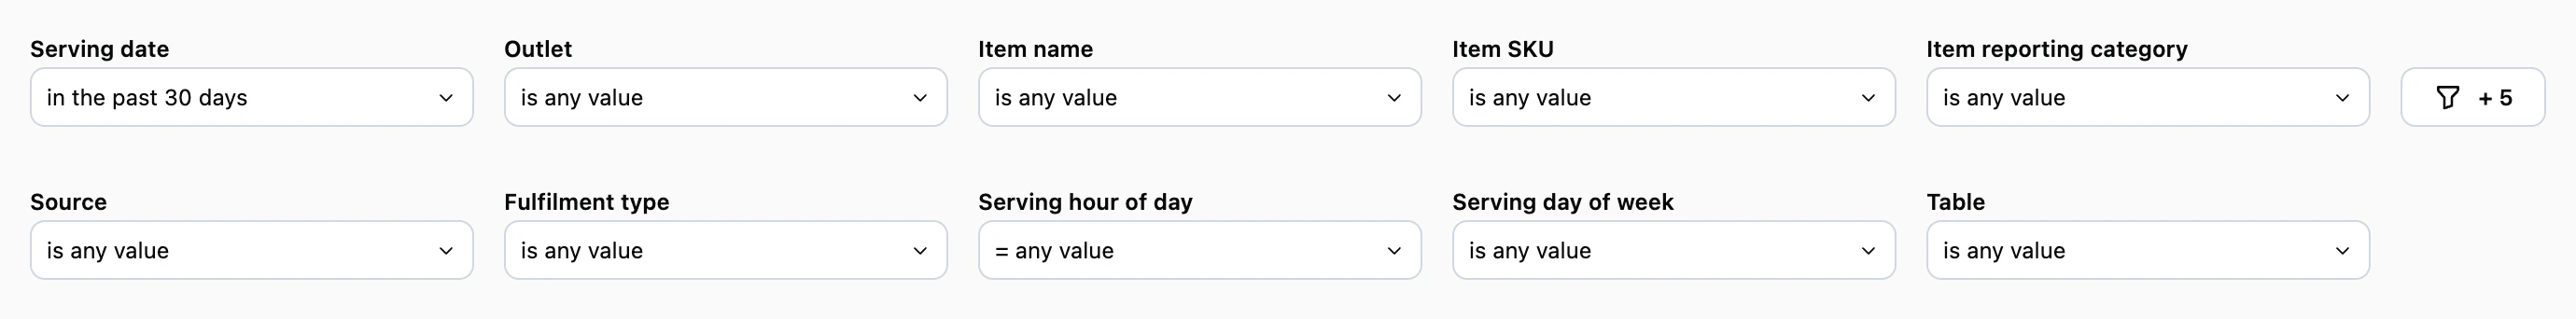
- Serving date — Date range. Defaults to past 30 days.
- Outlet — Filter by outlet.
- Item name — Search for specific products.
- Item SKU — Filter by SKU.
- Item reporting category — Filter by category.
- Source — Order source (POS, Kiosk, Web, etc.).
- Fulfilment type — Dine-in, Pickup, Delivery.
- Serving hour of day — Filter by hour.
- Serving day of week — Filter by day.
- Table — Filter by table.
Sections
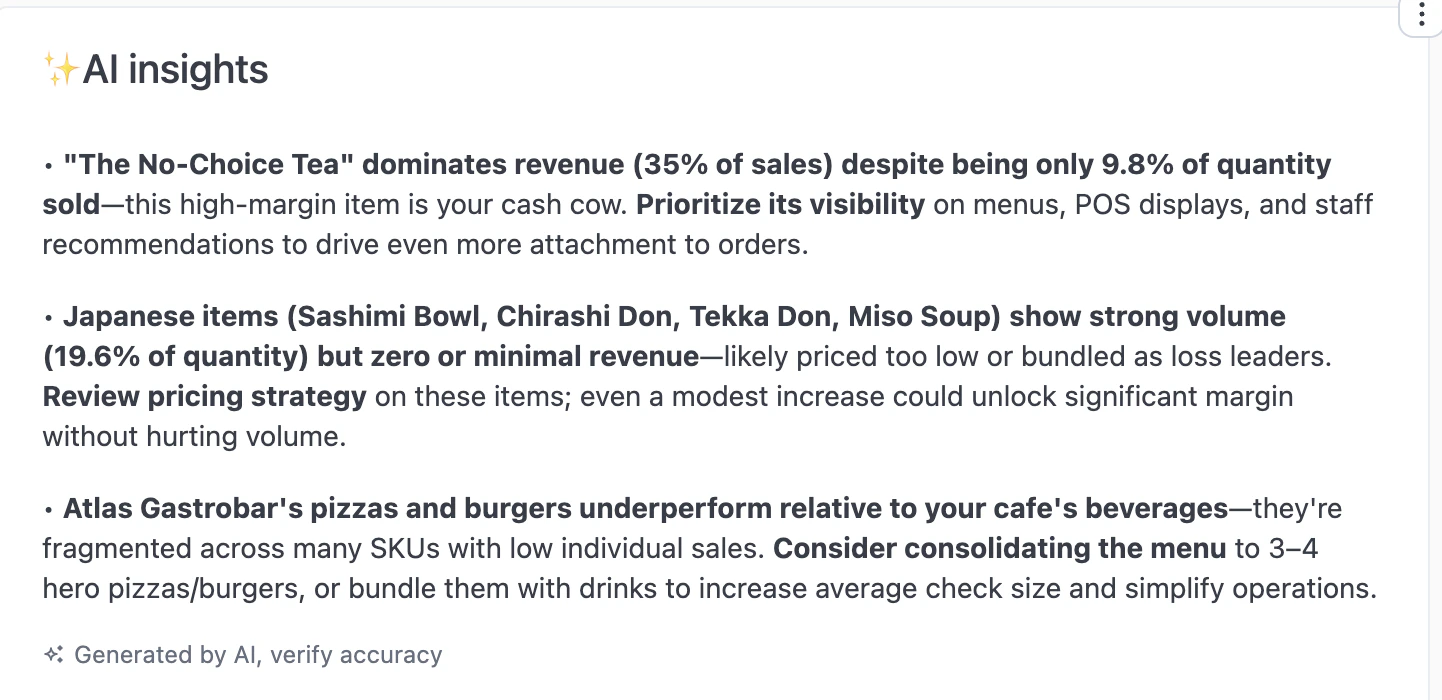
AI insights
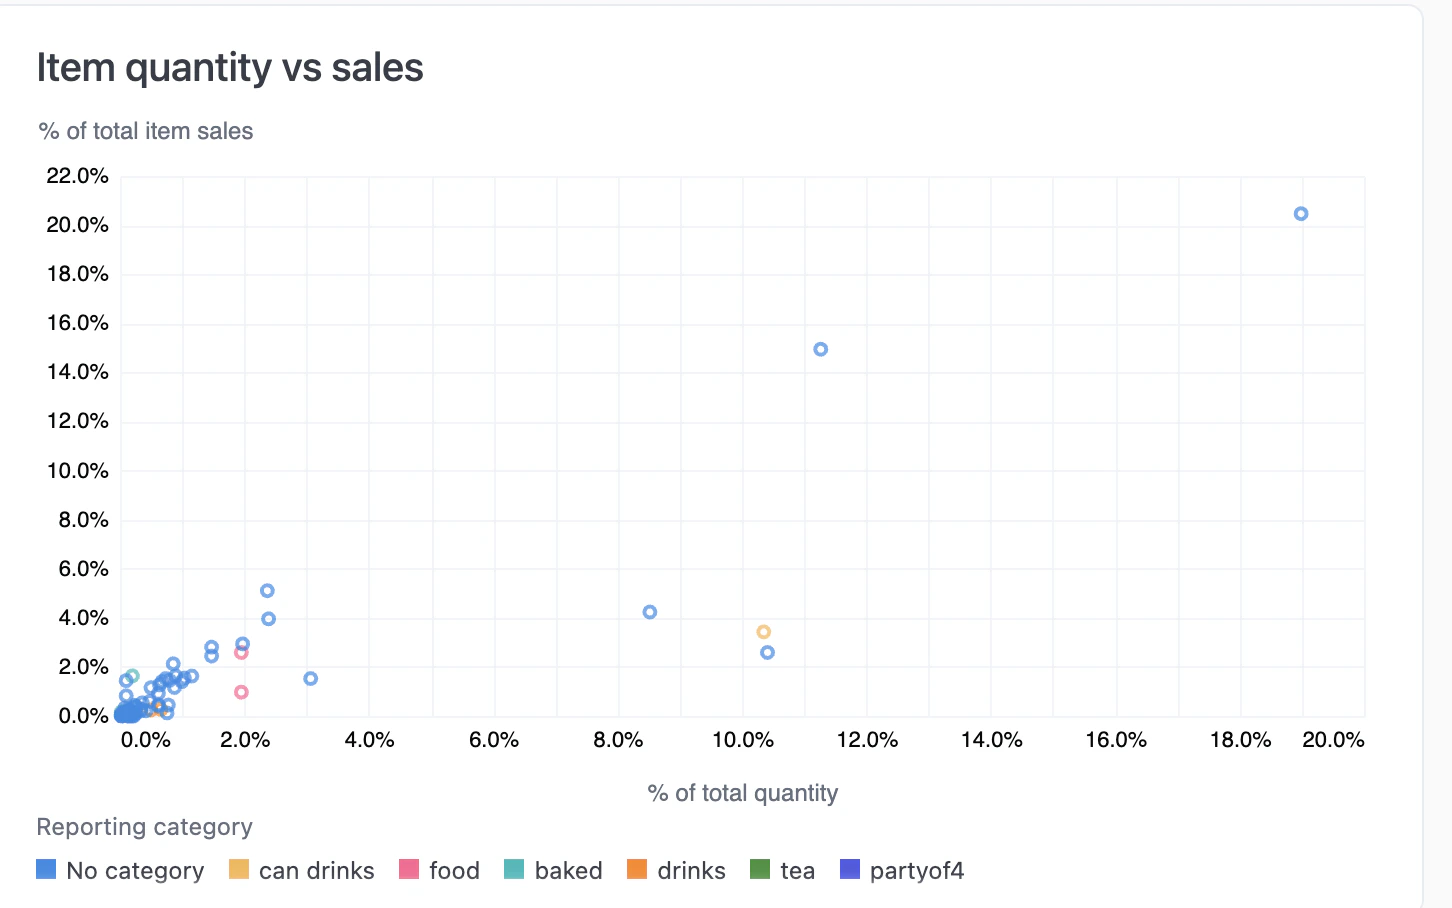
Item quantity vs sales
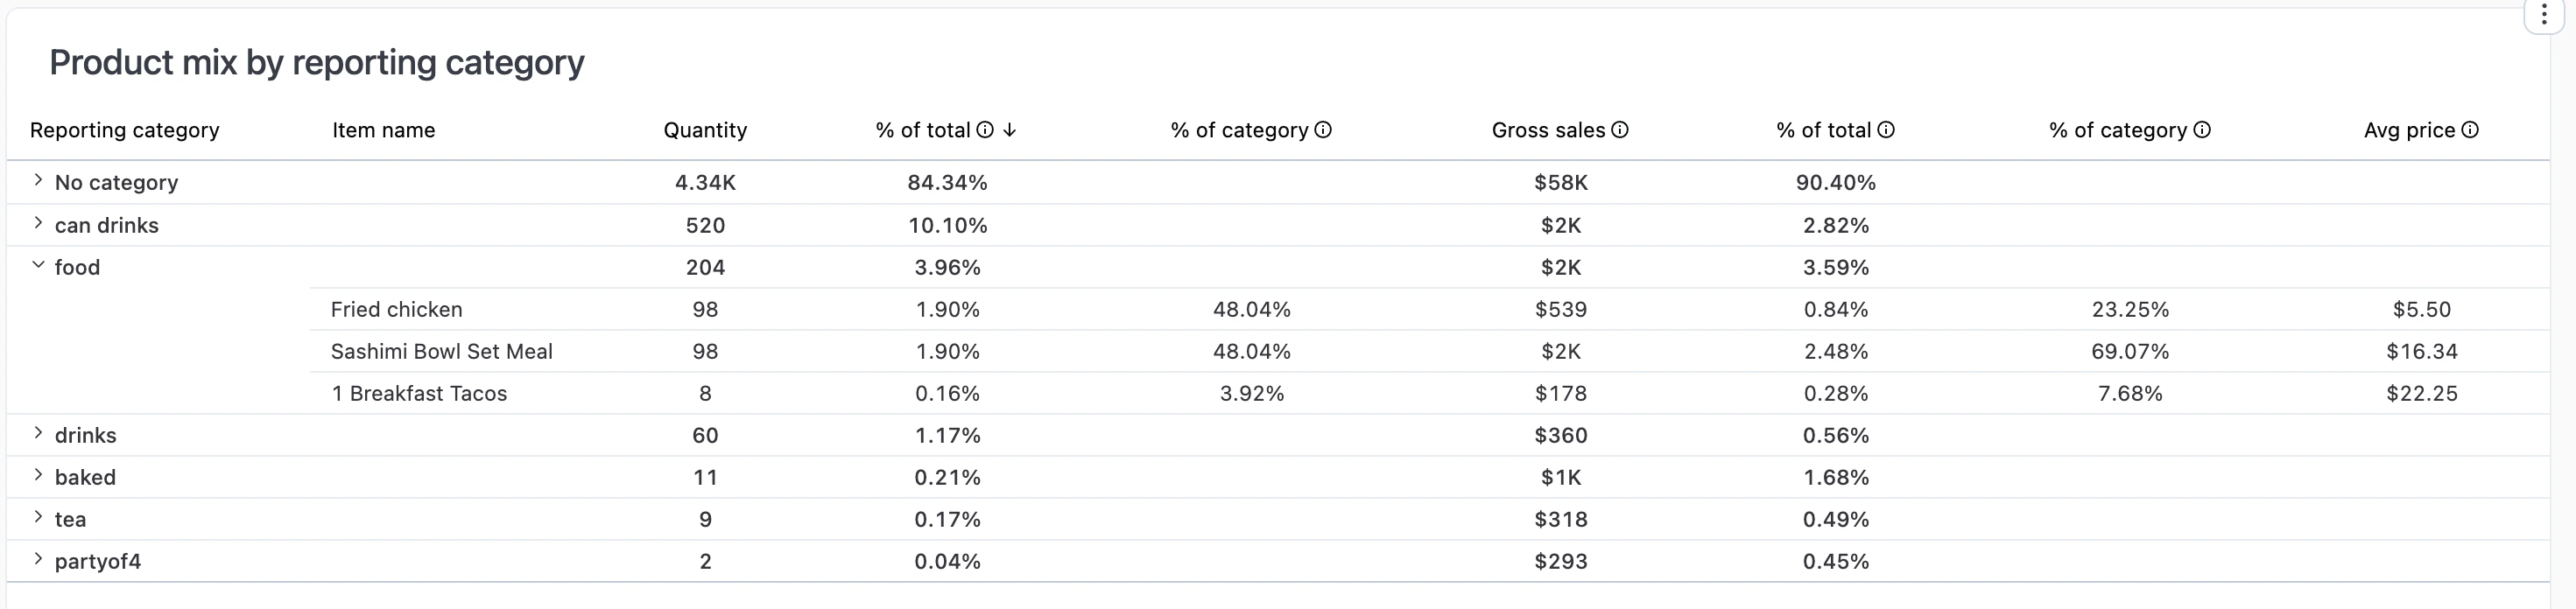
Product mix by reporting category
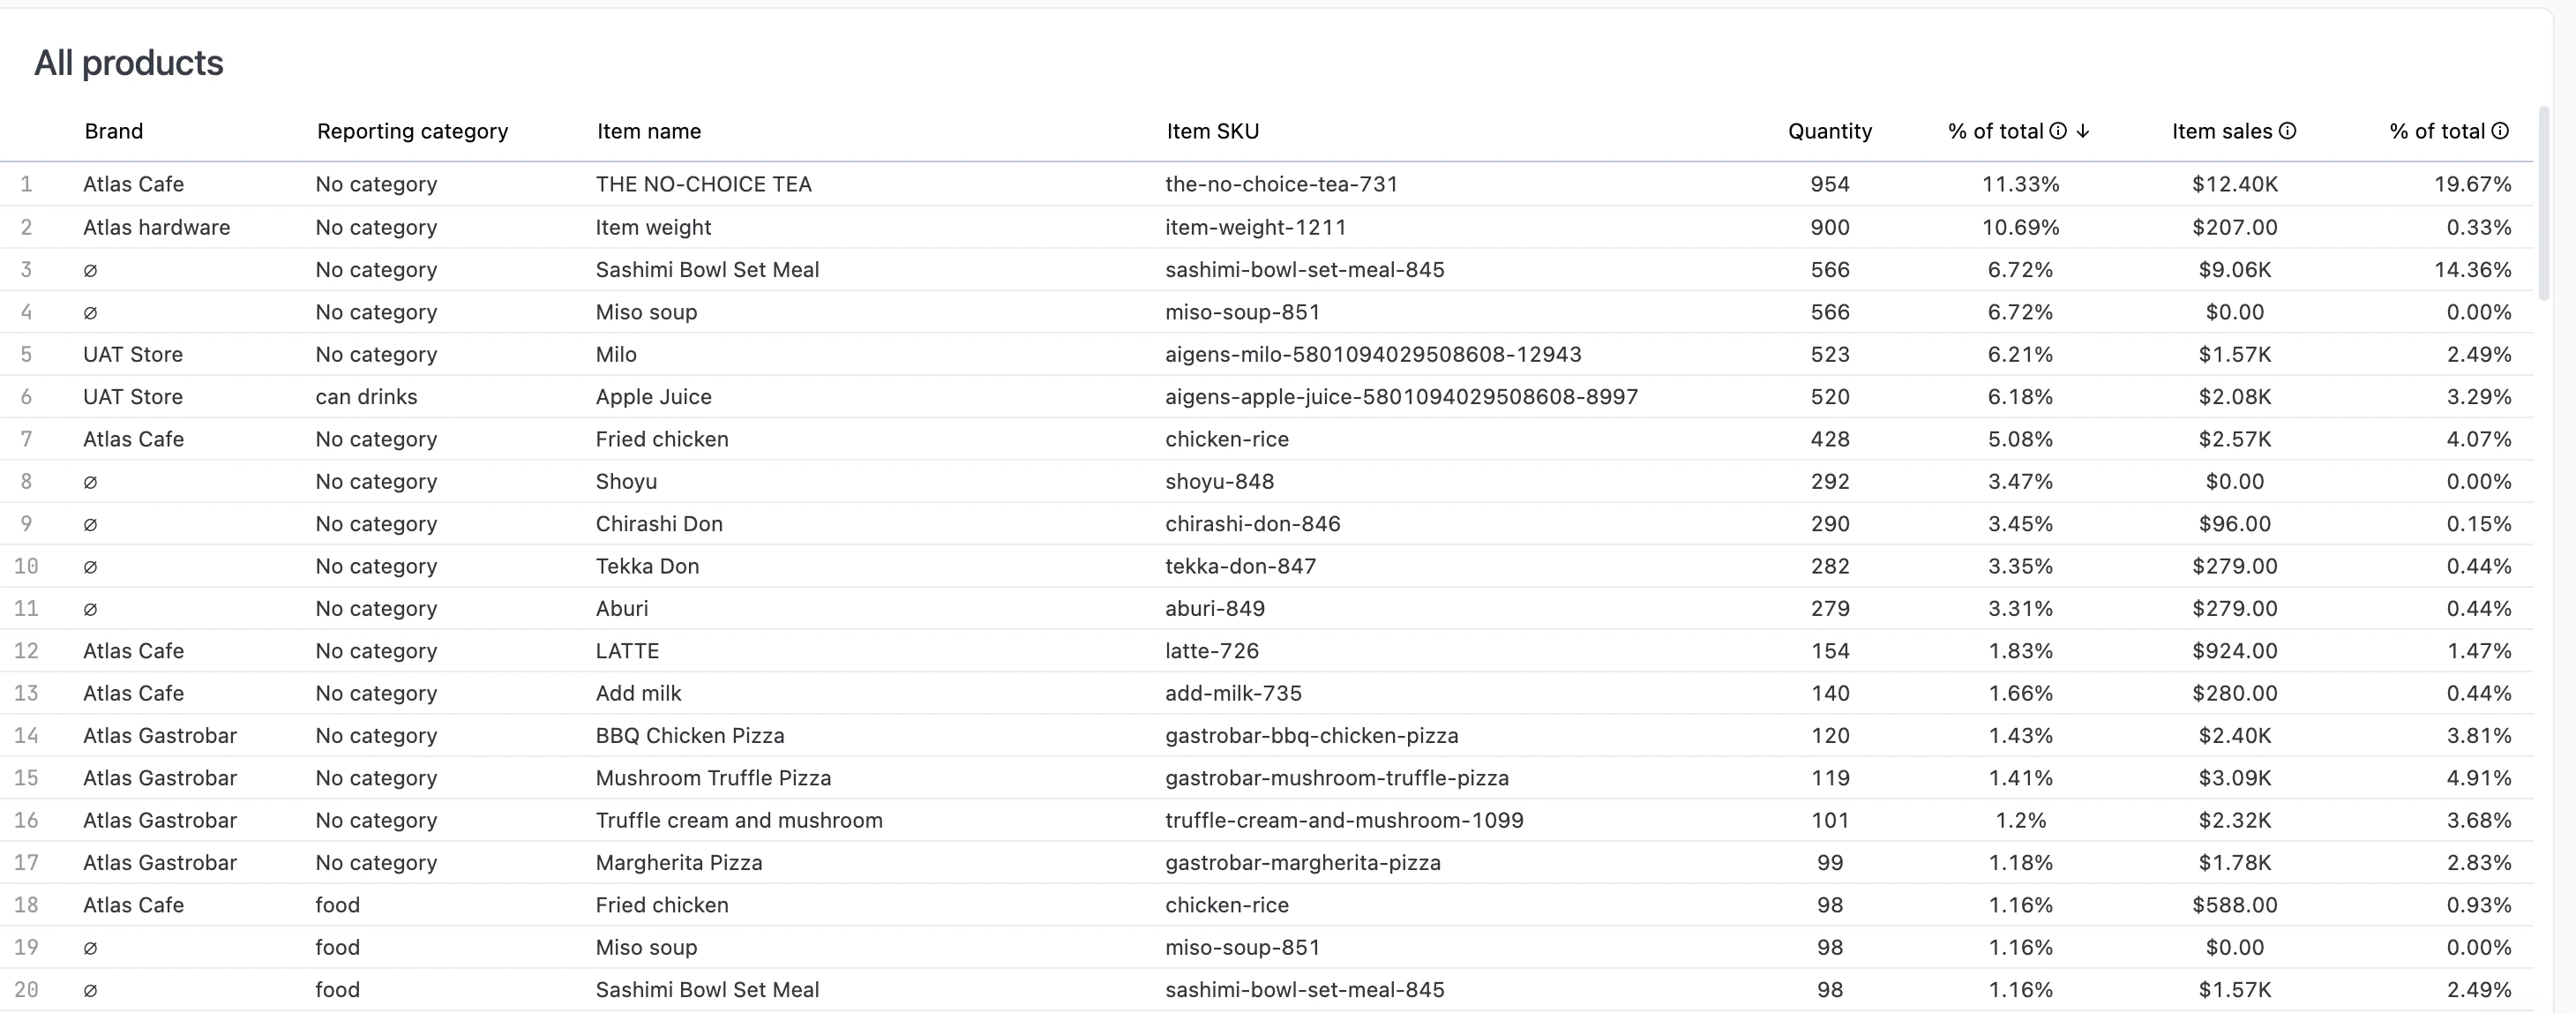
All products
Sales by team member
Gross sales broken down by team member and reporting category.Product name actions
Click an underlined product name to see available actions.- Single product view — Open a detailed dashboard for that product (see below).
- Modifier groups used in — Jump to the Modifier groups tab, filtered to show which modifier groups include this product.
Single product view
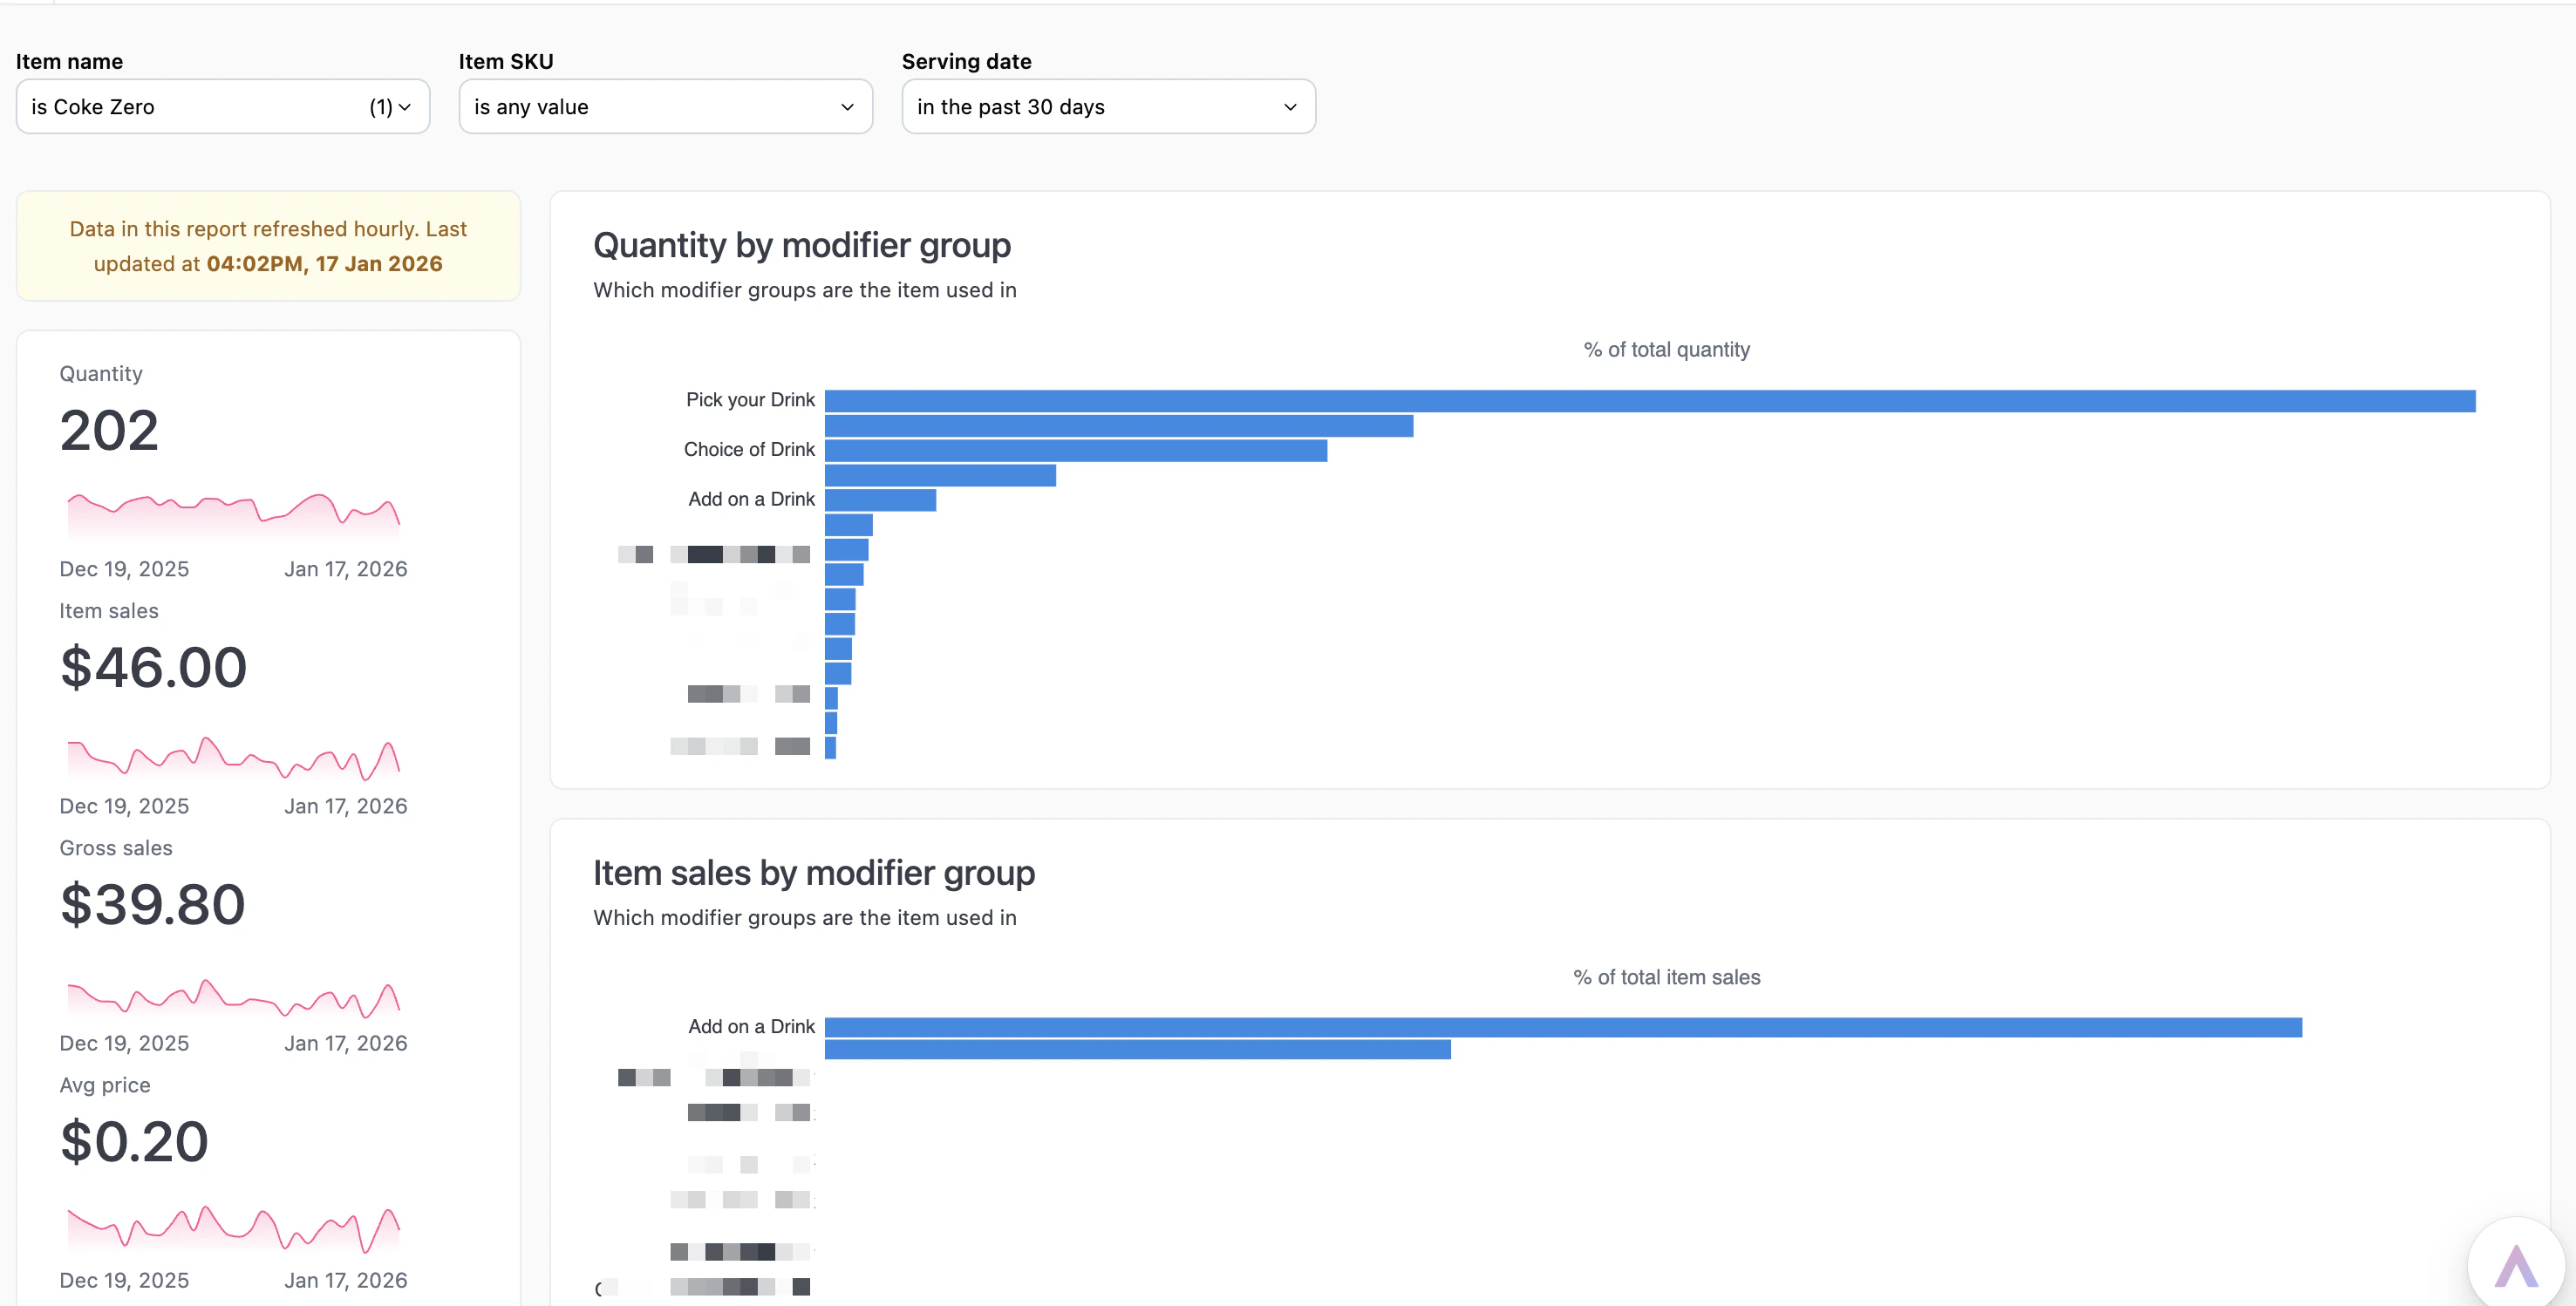
- Metrics — Quantity, item sales, gross sales, average price over time.
- Quantity by modifier group — Which modifier groups include this product.
- Item sales by modifier group — Revenue contribution by modifier group.
Drilling into data
Click any metric value to drill into the underlying data.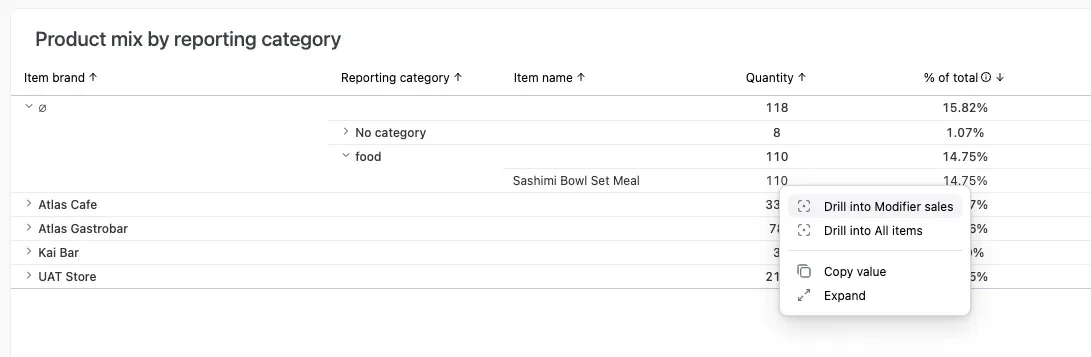
- Drill into Modifier sales — See how different modifiers performed for that product.
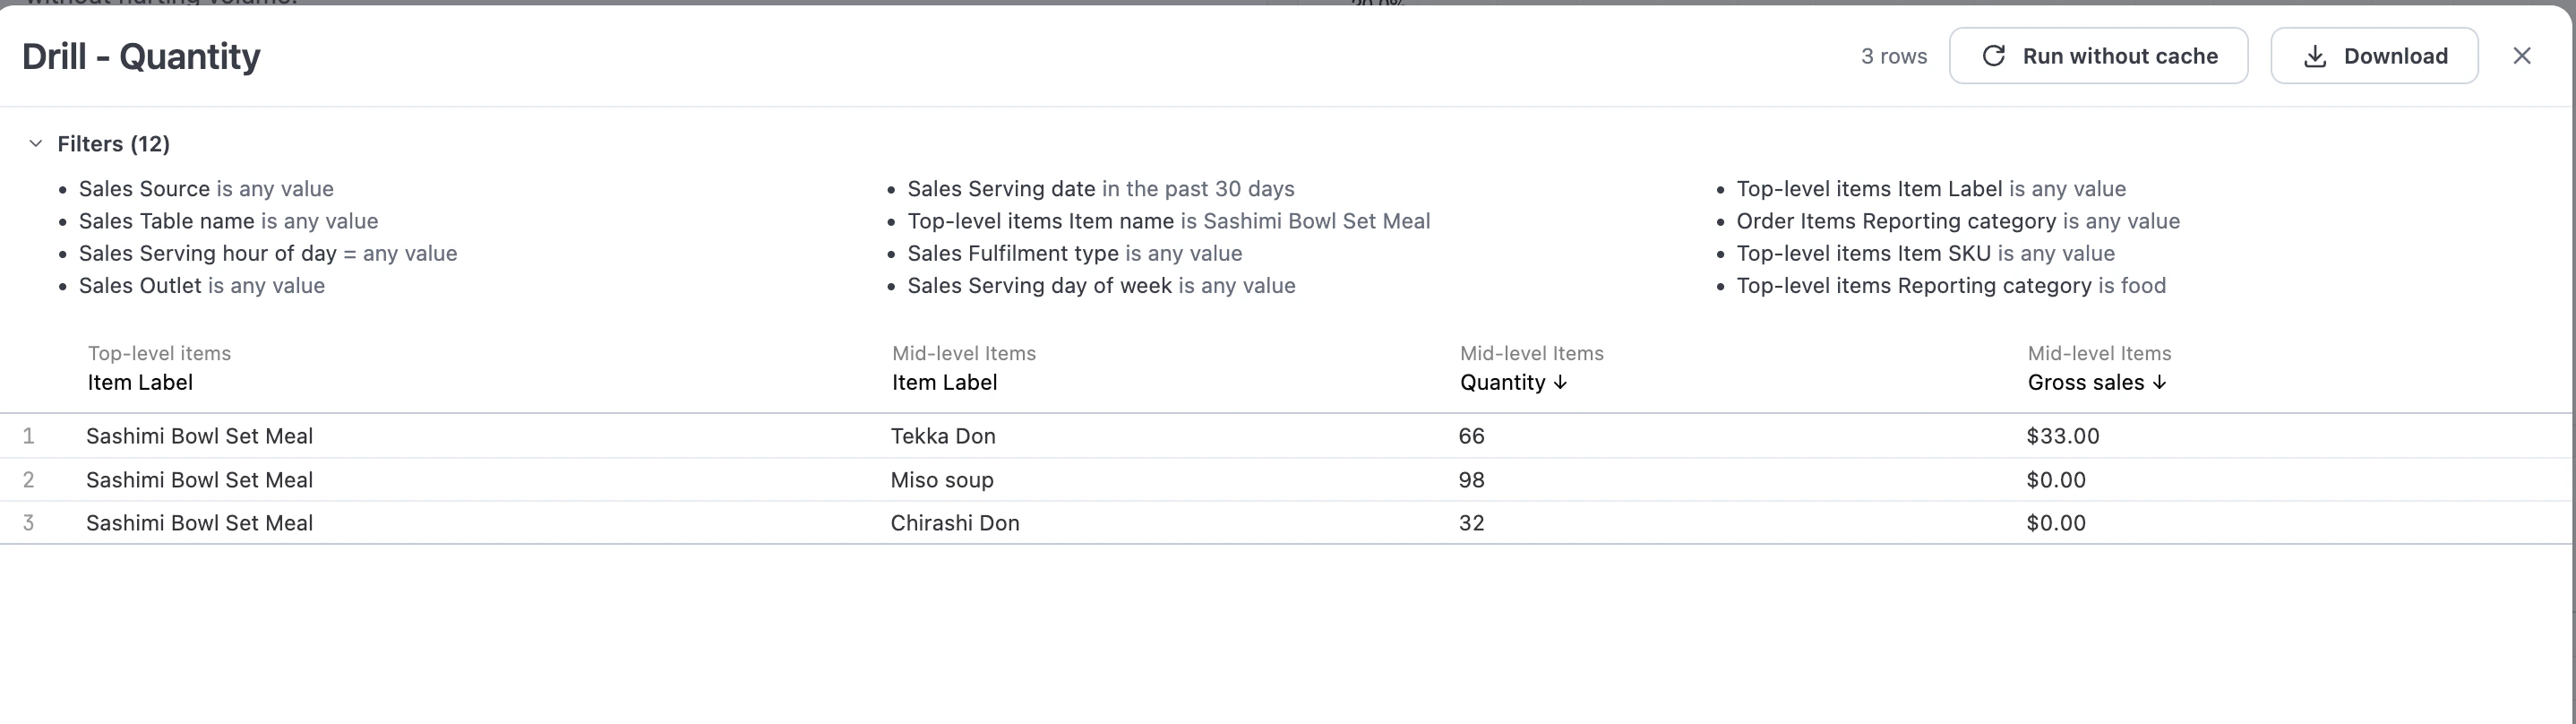
- Drill into All items — View every order item that contributed to that metric.
Interactive features
- Drill down — Click any metric to see underlying data.
- Download — Export data from any chart or table.
- Copy values — Click any metric to copy to clipboard.
- AI assistant — Ask questions about your data. See Using reports.