What this report shows
Order-level sales data for daily reconciliation. View every order, track payments and refunds, and see breakdowns by channel, payment type, and brand.Data refreshes in real-time. Click Refresh now to update.
Filters
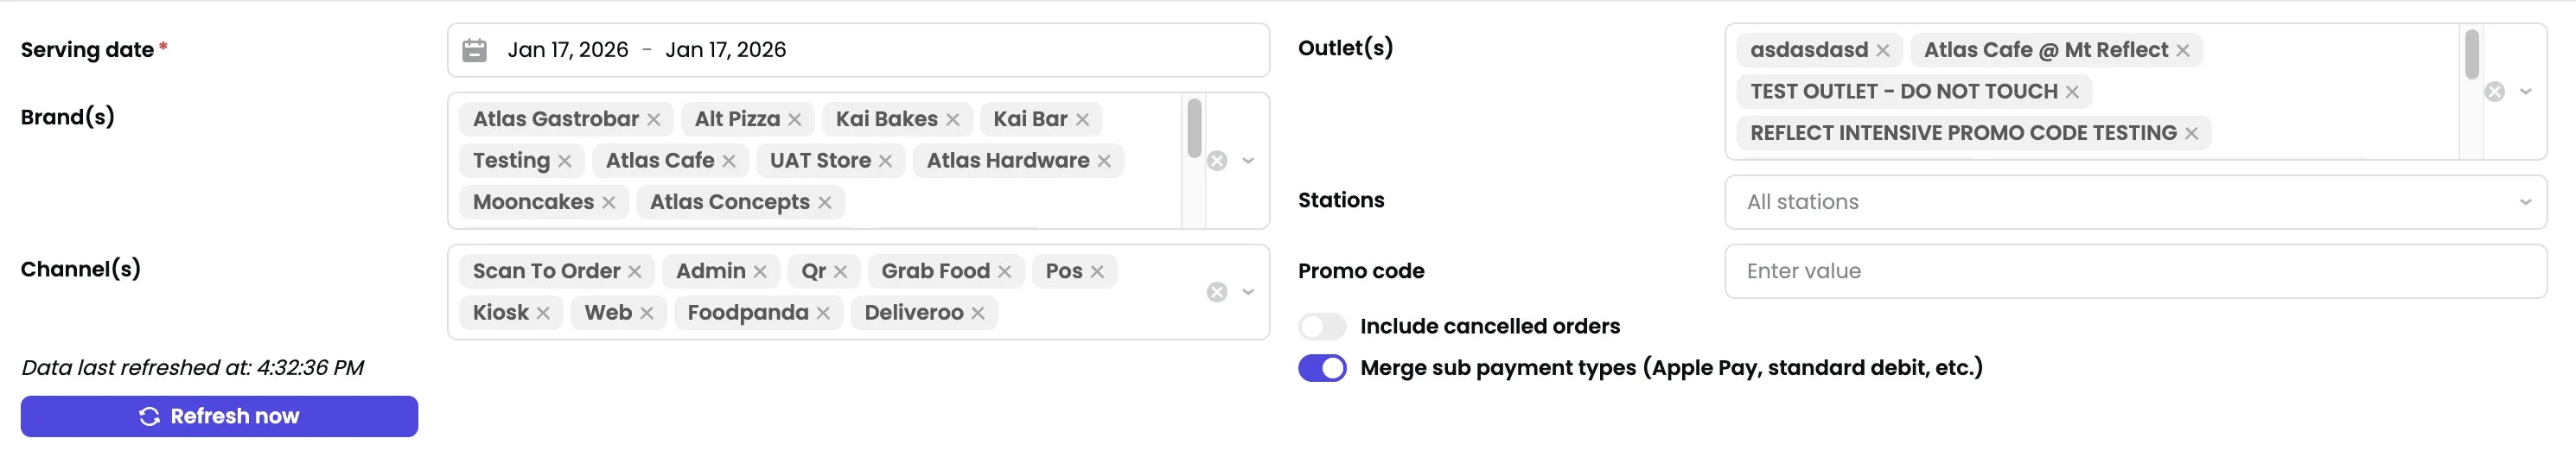
- Serving date — Date range for orders.
- Brand(s) — Filter by brand.
- Channel(s) — Order source (POS, Scan to Order, Kiosk, Web, Grab Food, etc.)
- Outlet(s) — Filter by outlet.
- Stations — Filter by station.
- Promo code — Filter by specific promo code.
- Include cancelled orders — Toggle to include or exclude cancelled orders.
- Merge sub payment types — Combine payment subtypes (e.g., Apple Pay, standard debit) into main types.
Sections
Key metrics
Summary of sales for the selected period: gross sales, discounts, net sales, delivery fee, service charge, and total sales. Also shows refunds and platform-sponsored amounts.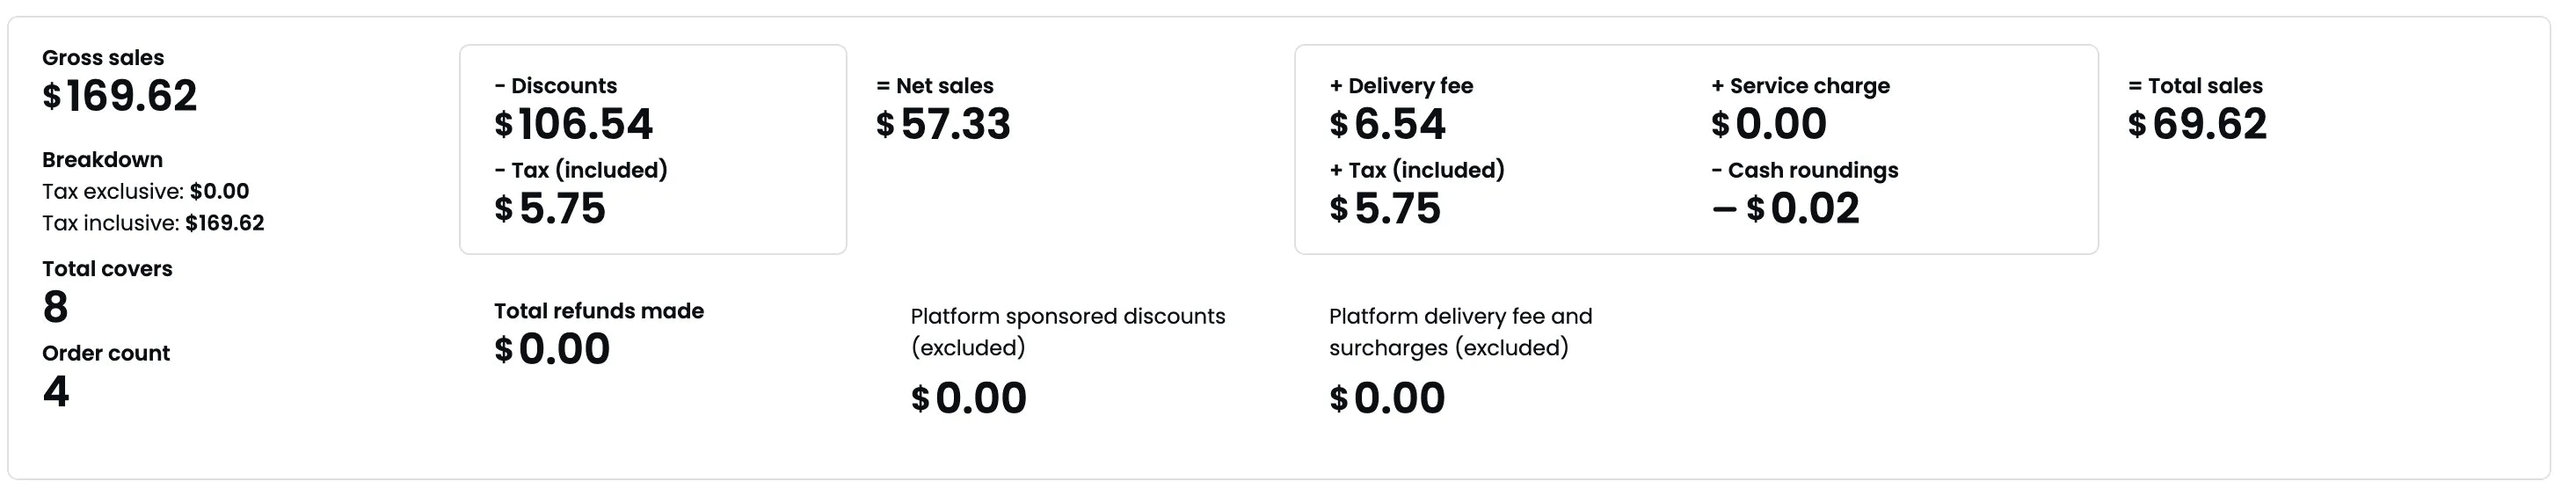
Orders
Every order in the selected period with details: created time, serving time, order ID, status, brand, outlet, station, table, channel, and fulfillment type.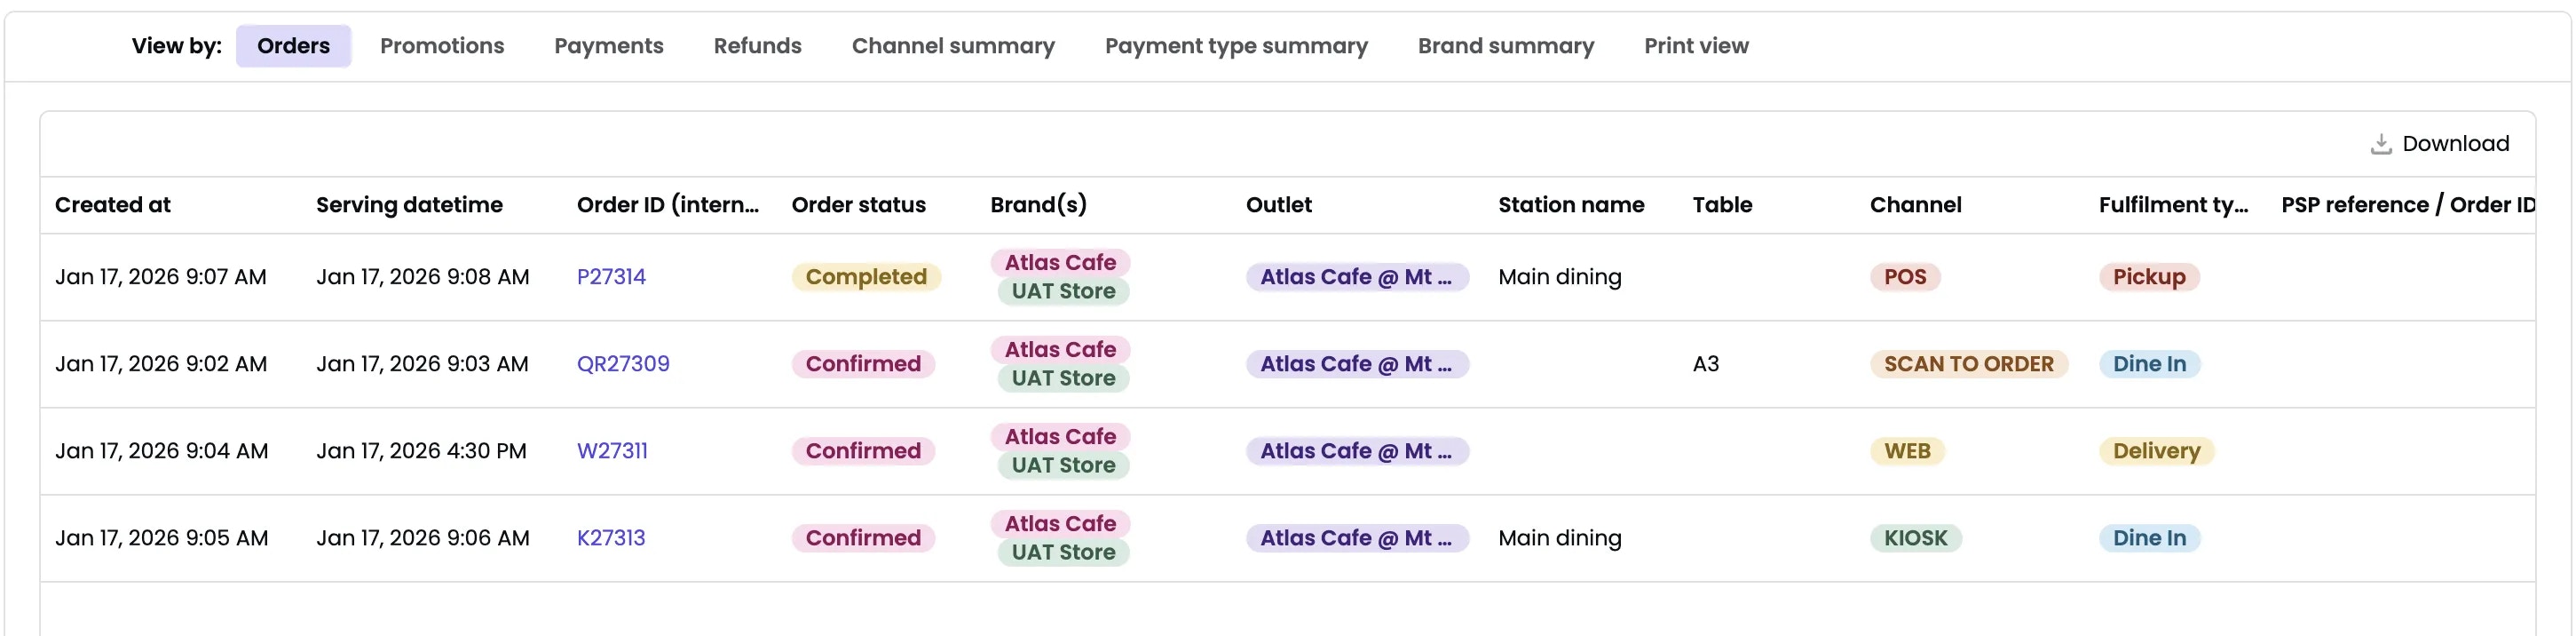
Promotions
Promo code performance: order count, gross sales, discount amount, average discount percentage, net sales, and total sales per promo code.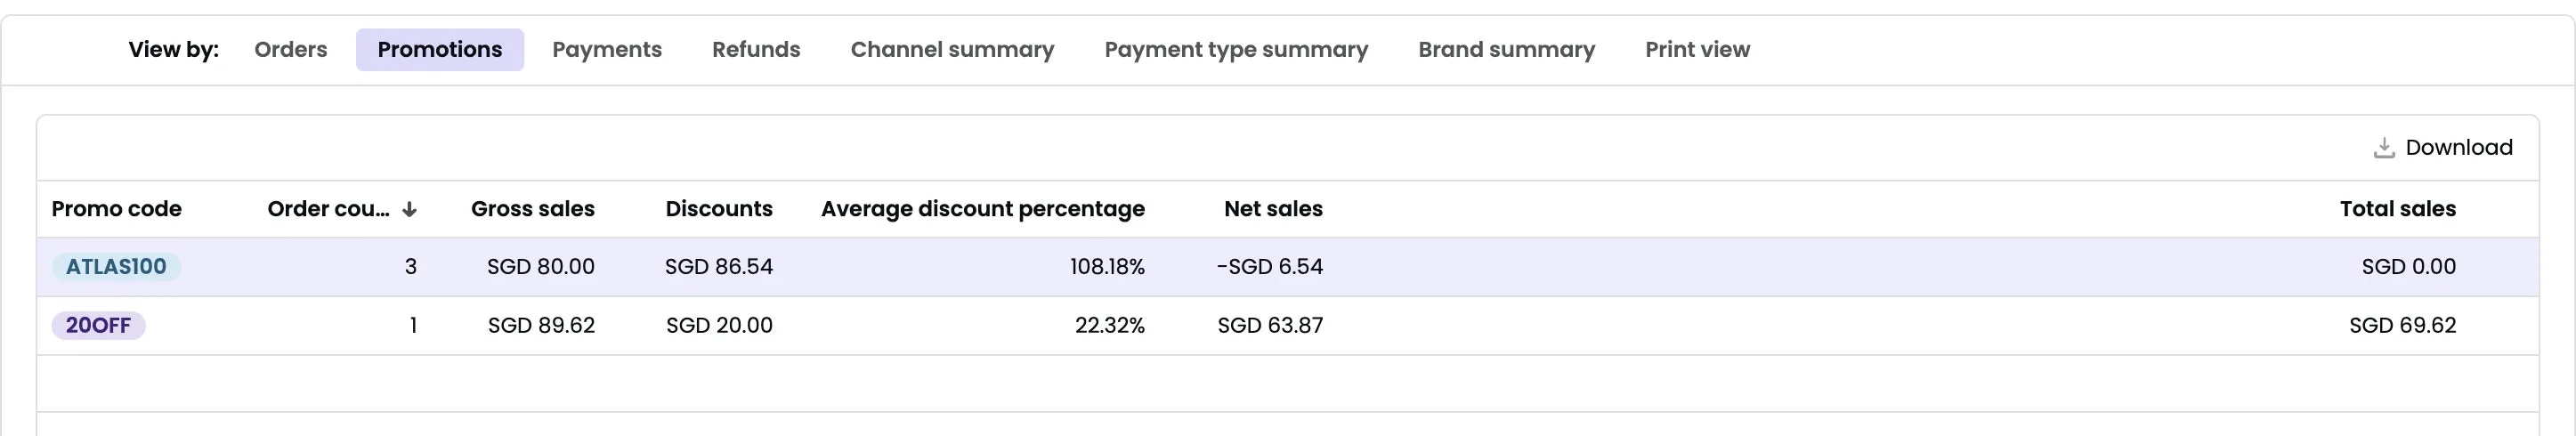
Payments
Individual payment transactions with order details, outlet, station, channel, capture type, PSP reference, payment type, and card details.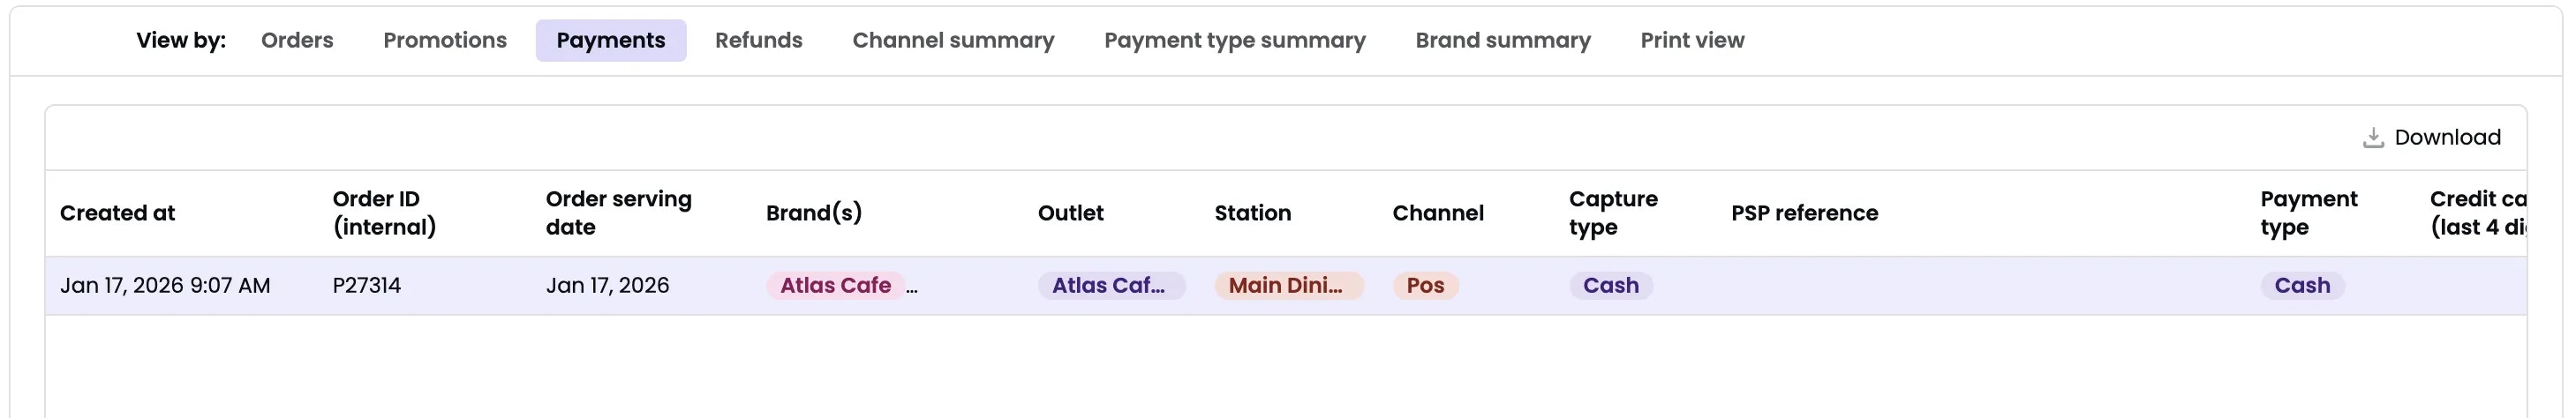
Refunds
Refund records with order details, payment type, PSP reference, refund amount, and reason.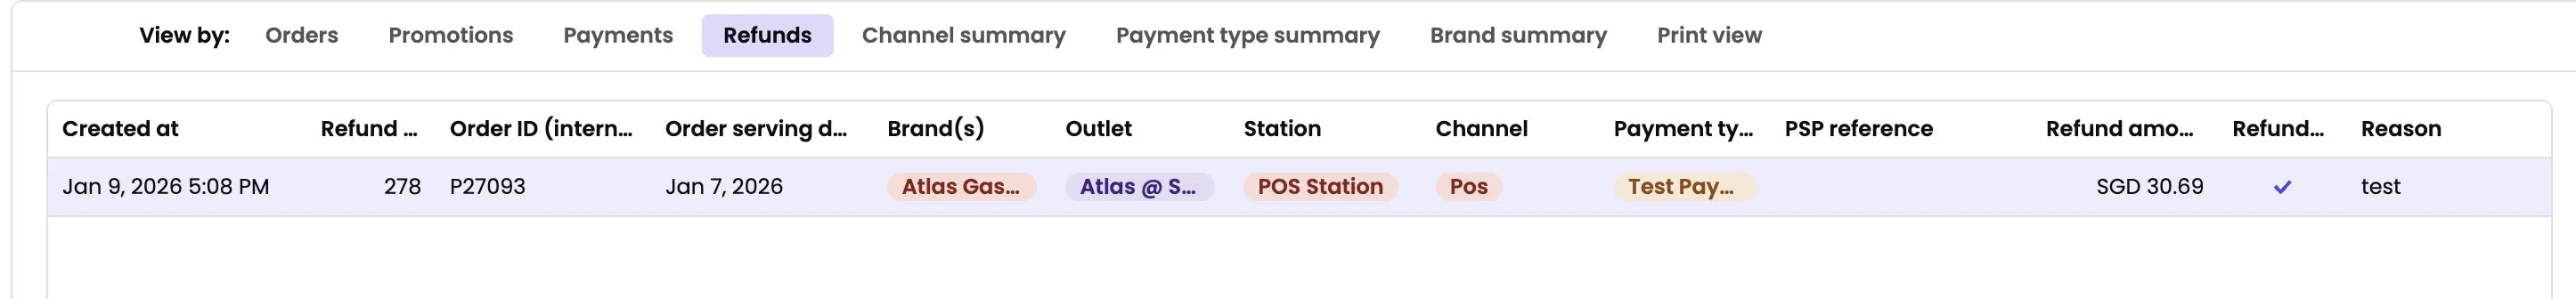
Channel summary
Sales breakdown by channel (Kiosk, POS, Scan to Order, Web, etc.) with order count, gross sales, net sales, total sales, payment amount, and refund amount.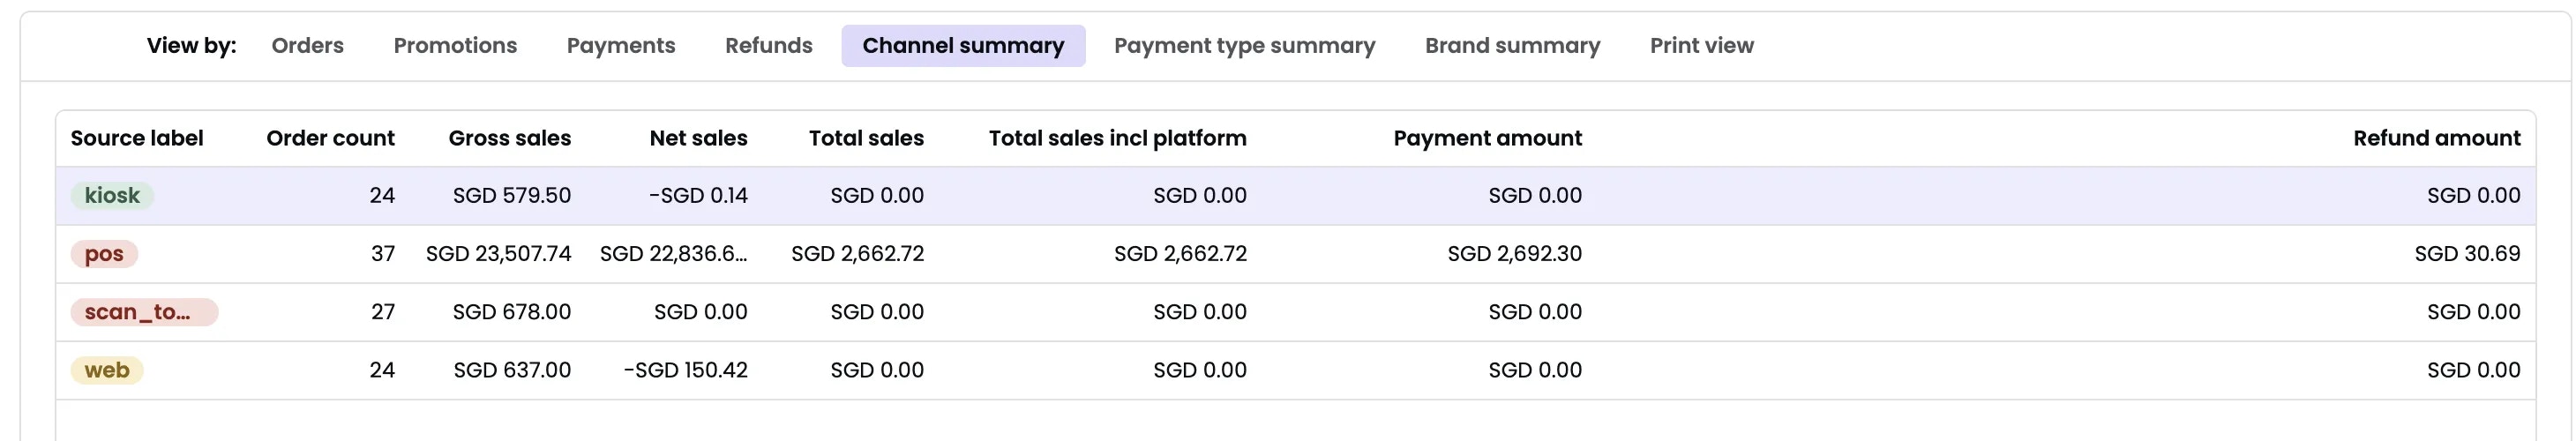
Payment type summary
Sales breakdown by payment method with order count, total paid, total captured, and total refunded.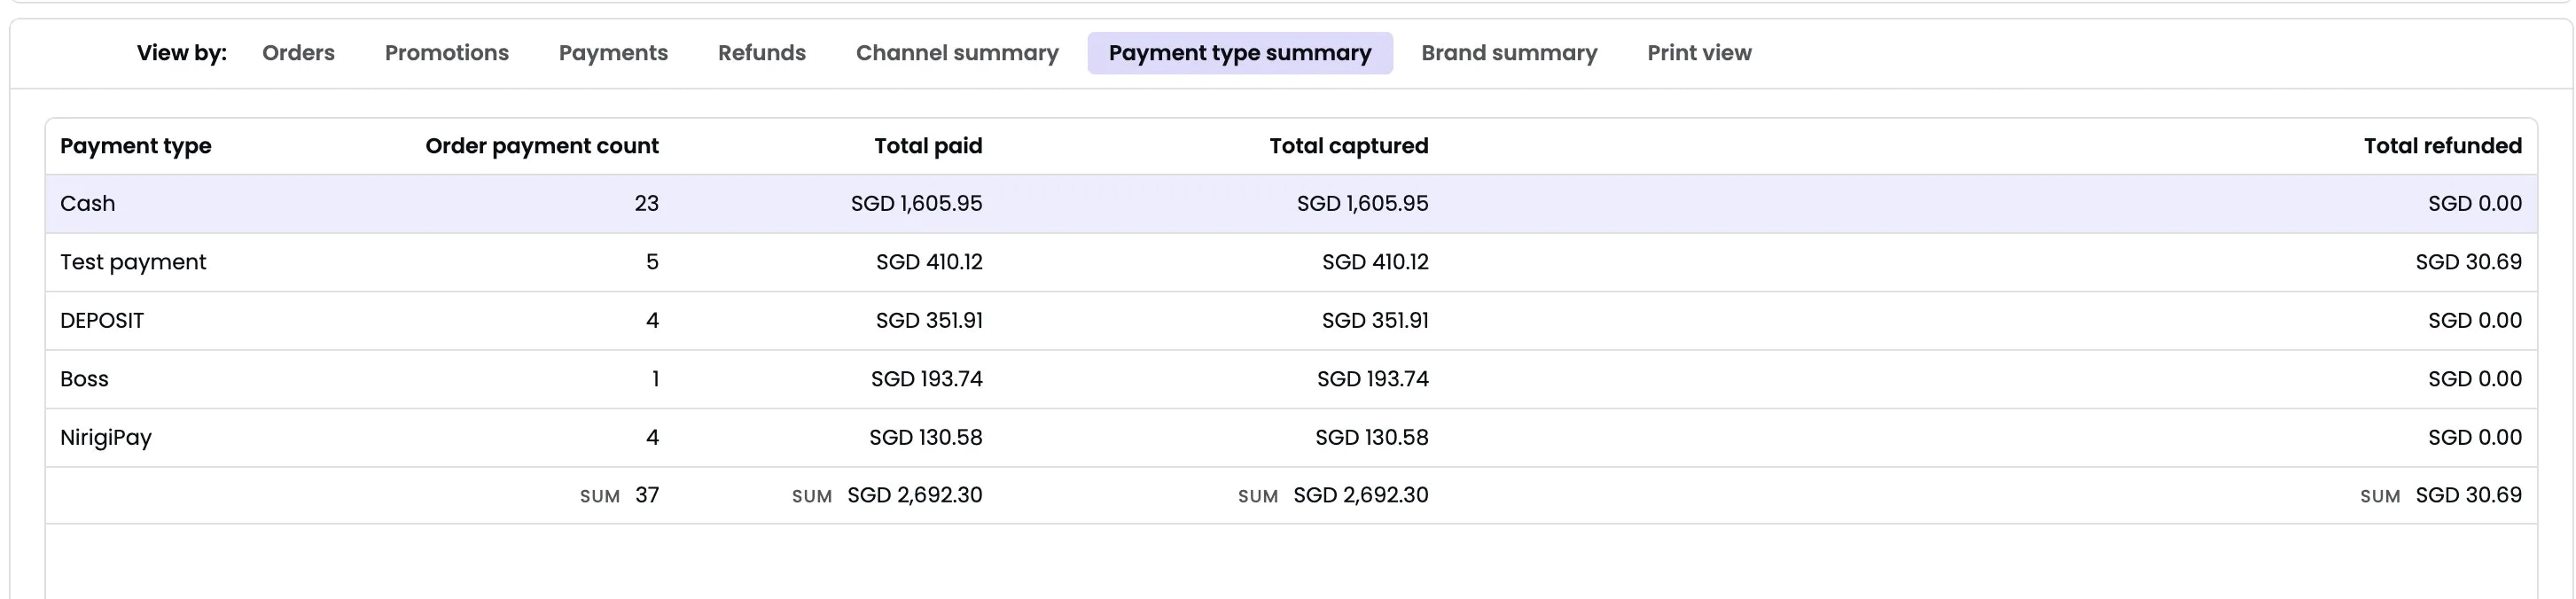
Brand summary
Sales breakdown by brand with gross sales, net sales, total sales, discounts, points used, delivery fees, donations, surcharges, service charges, taxes, roundings, and refunds.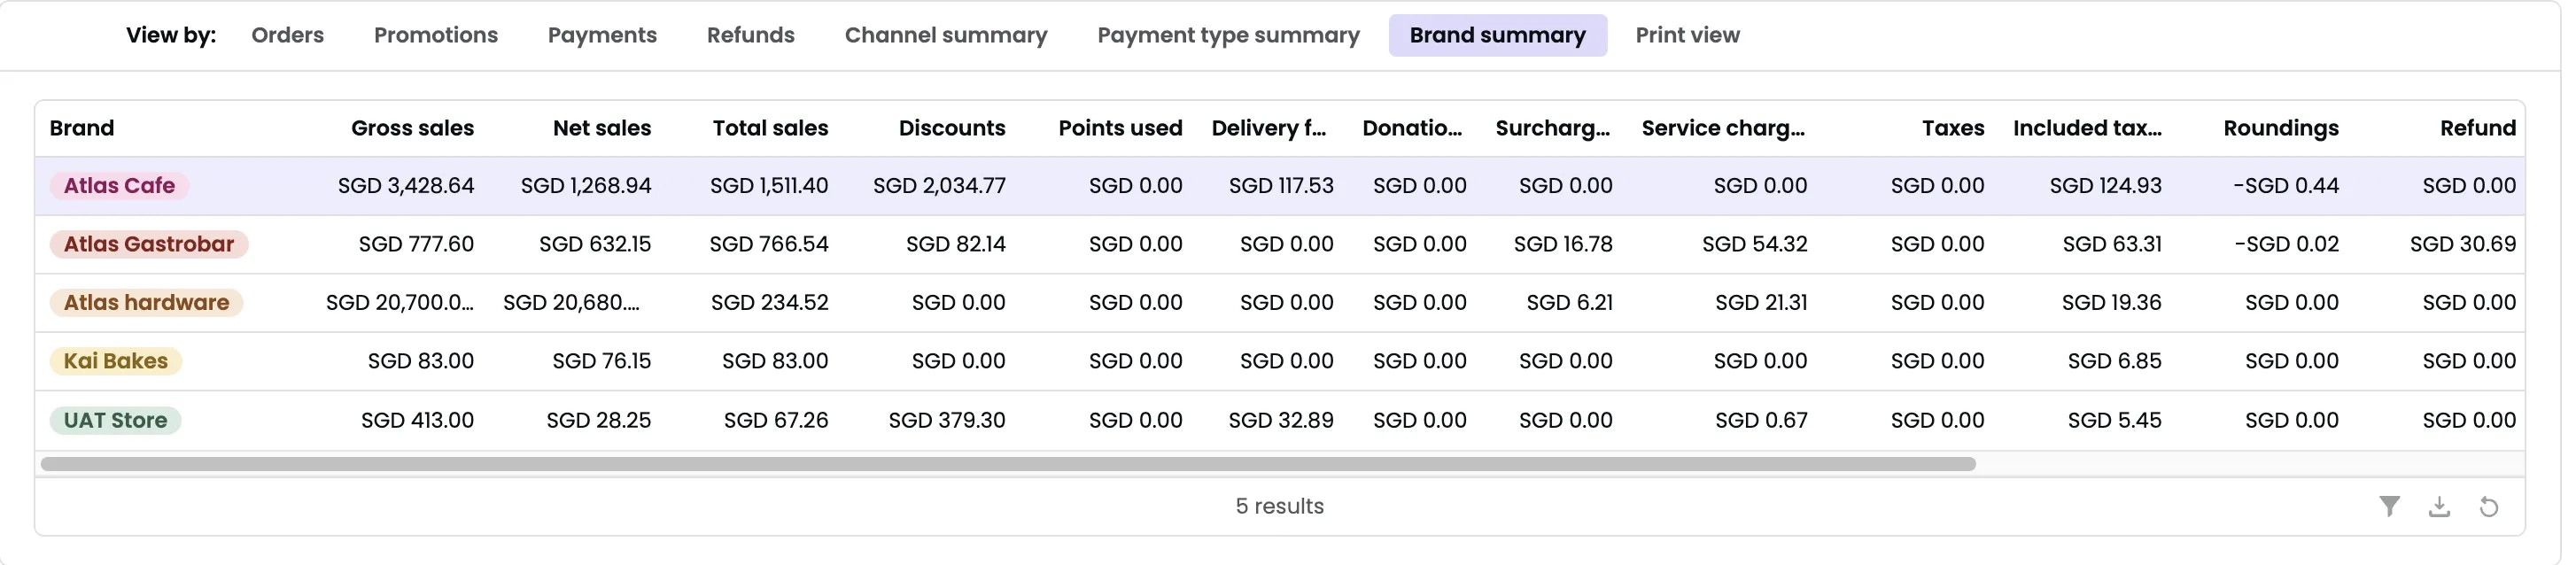
Print view
Consolidated view for printing or exporting to PDF. Shows selected filters and summarized data for payment types and channels.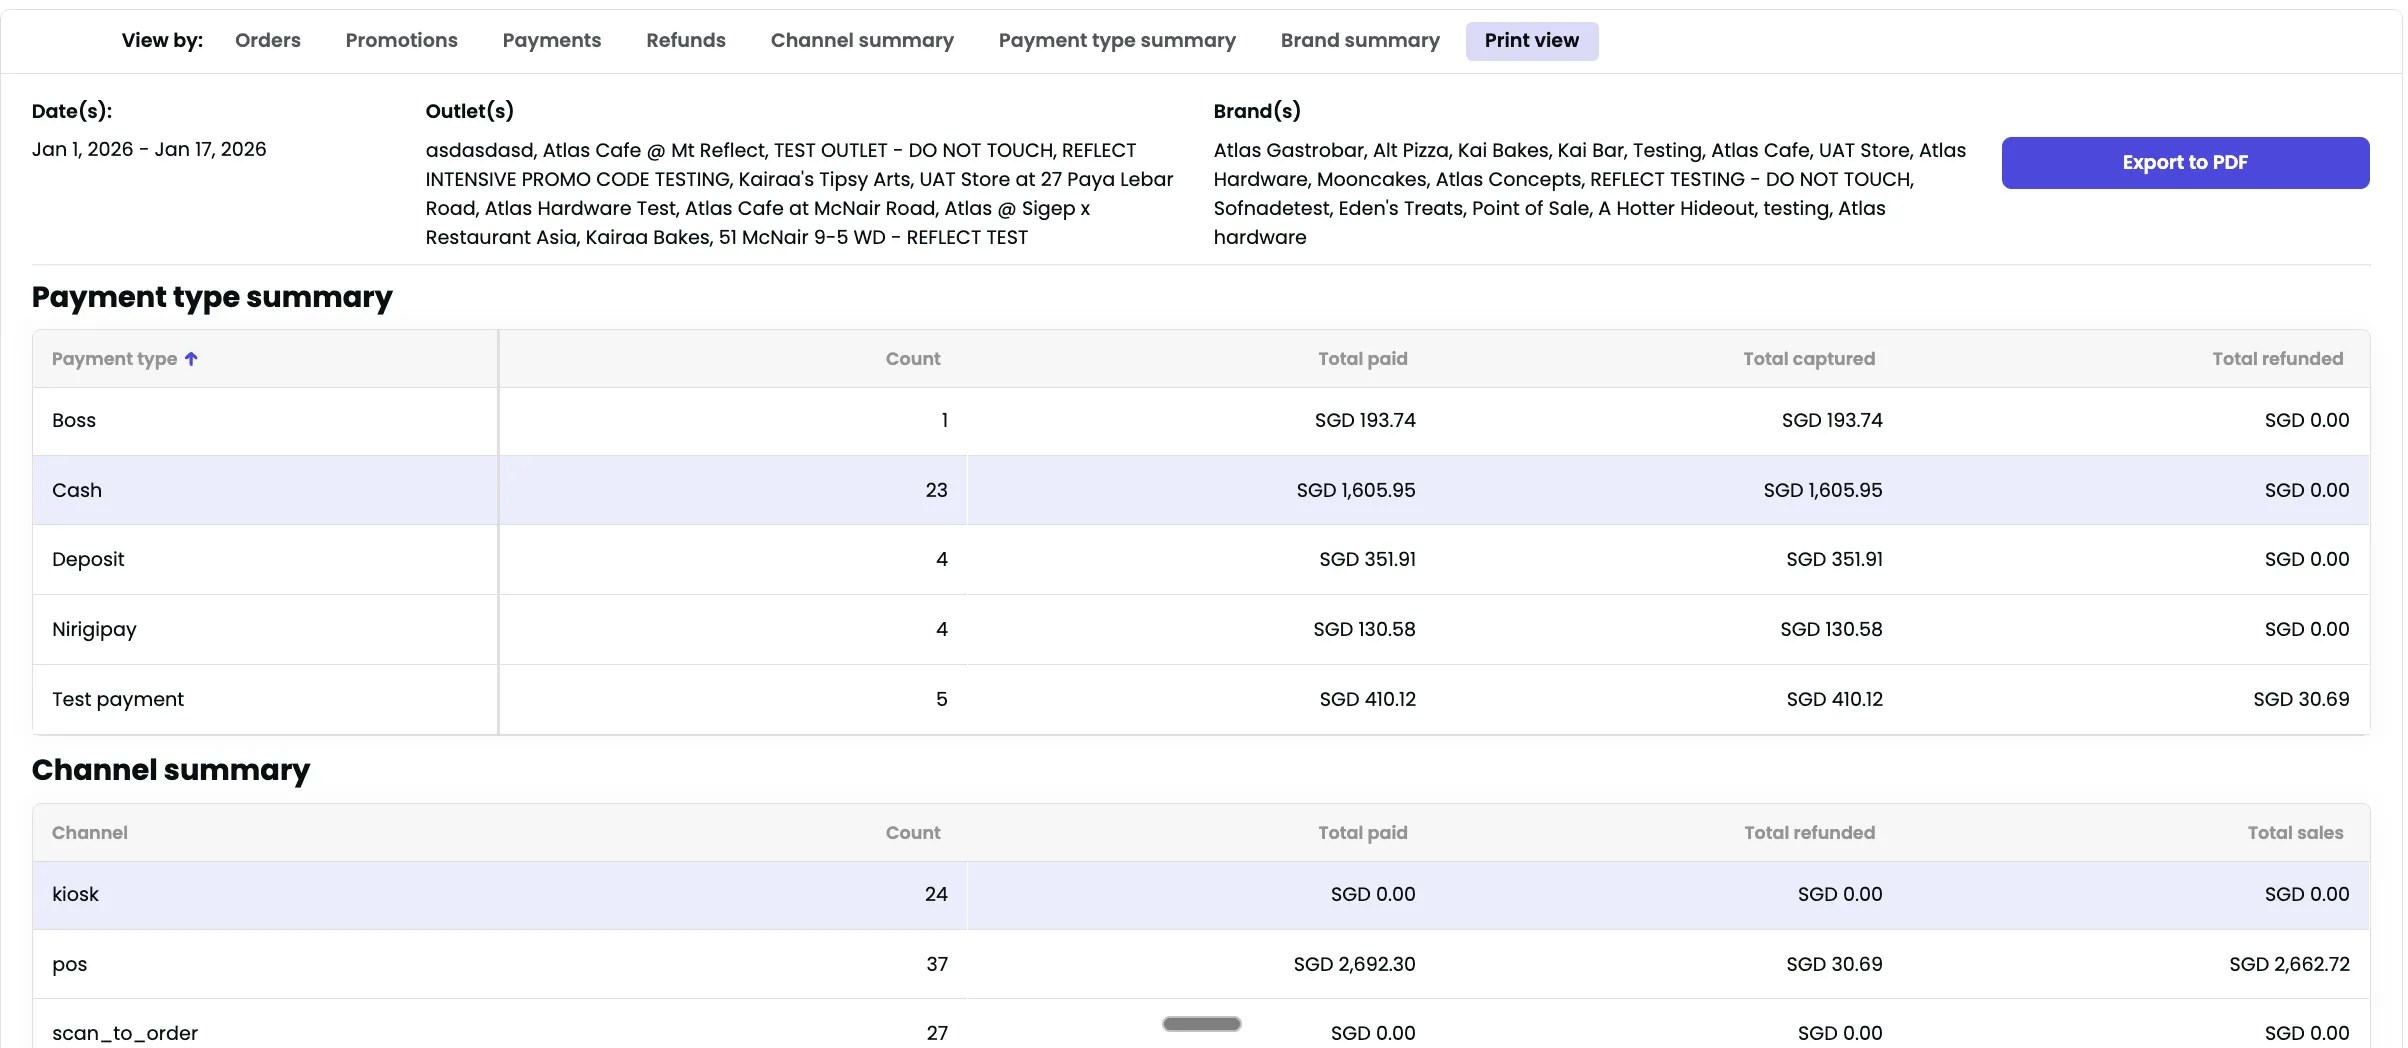
Exporting
- Download — Each tab has a Download button to export that view’s data.
- Export to PDF — Use Print view tab to export the full report as PDF.