What this report shows
A comprehensive overview of sales for a single day or custom period. Commonly used during shift closing to review sales, payments, and reconcile the day.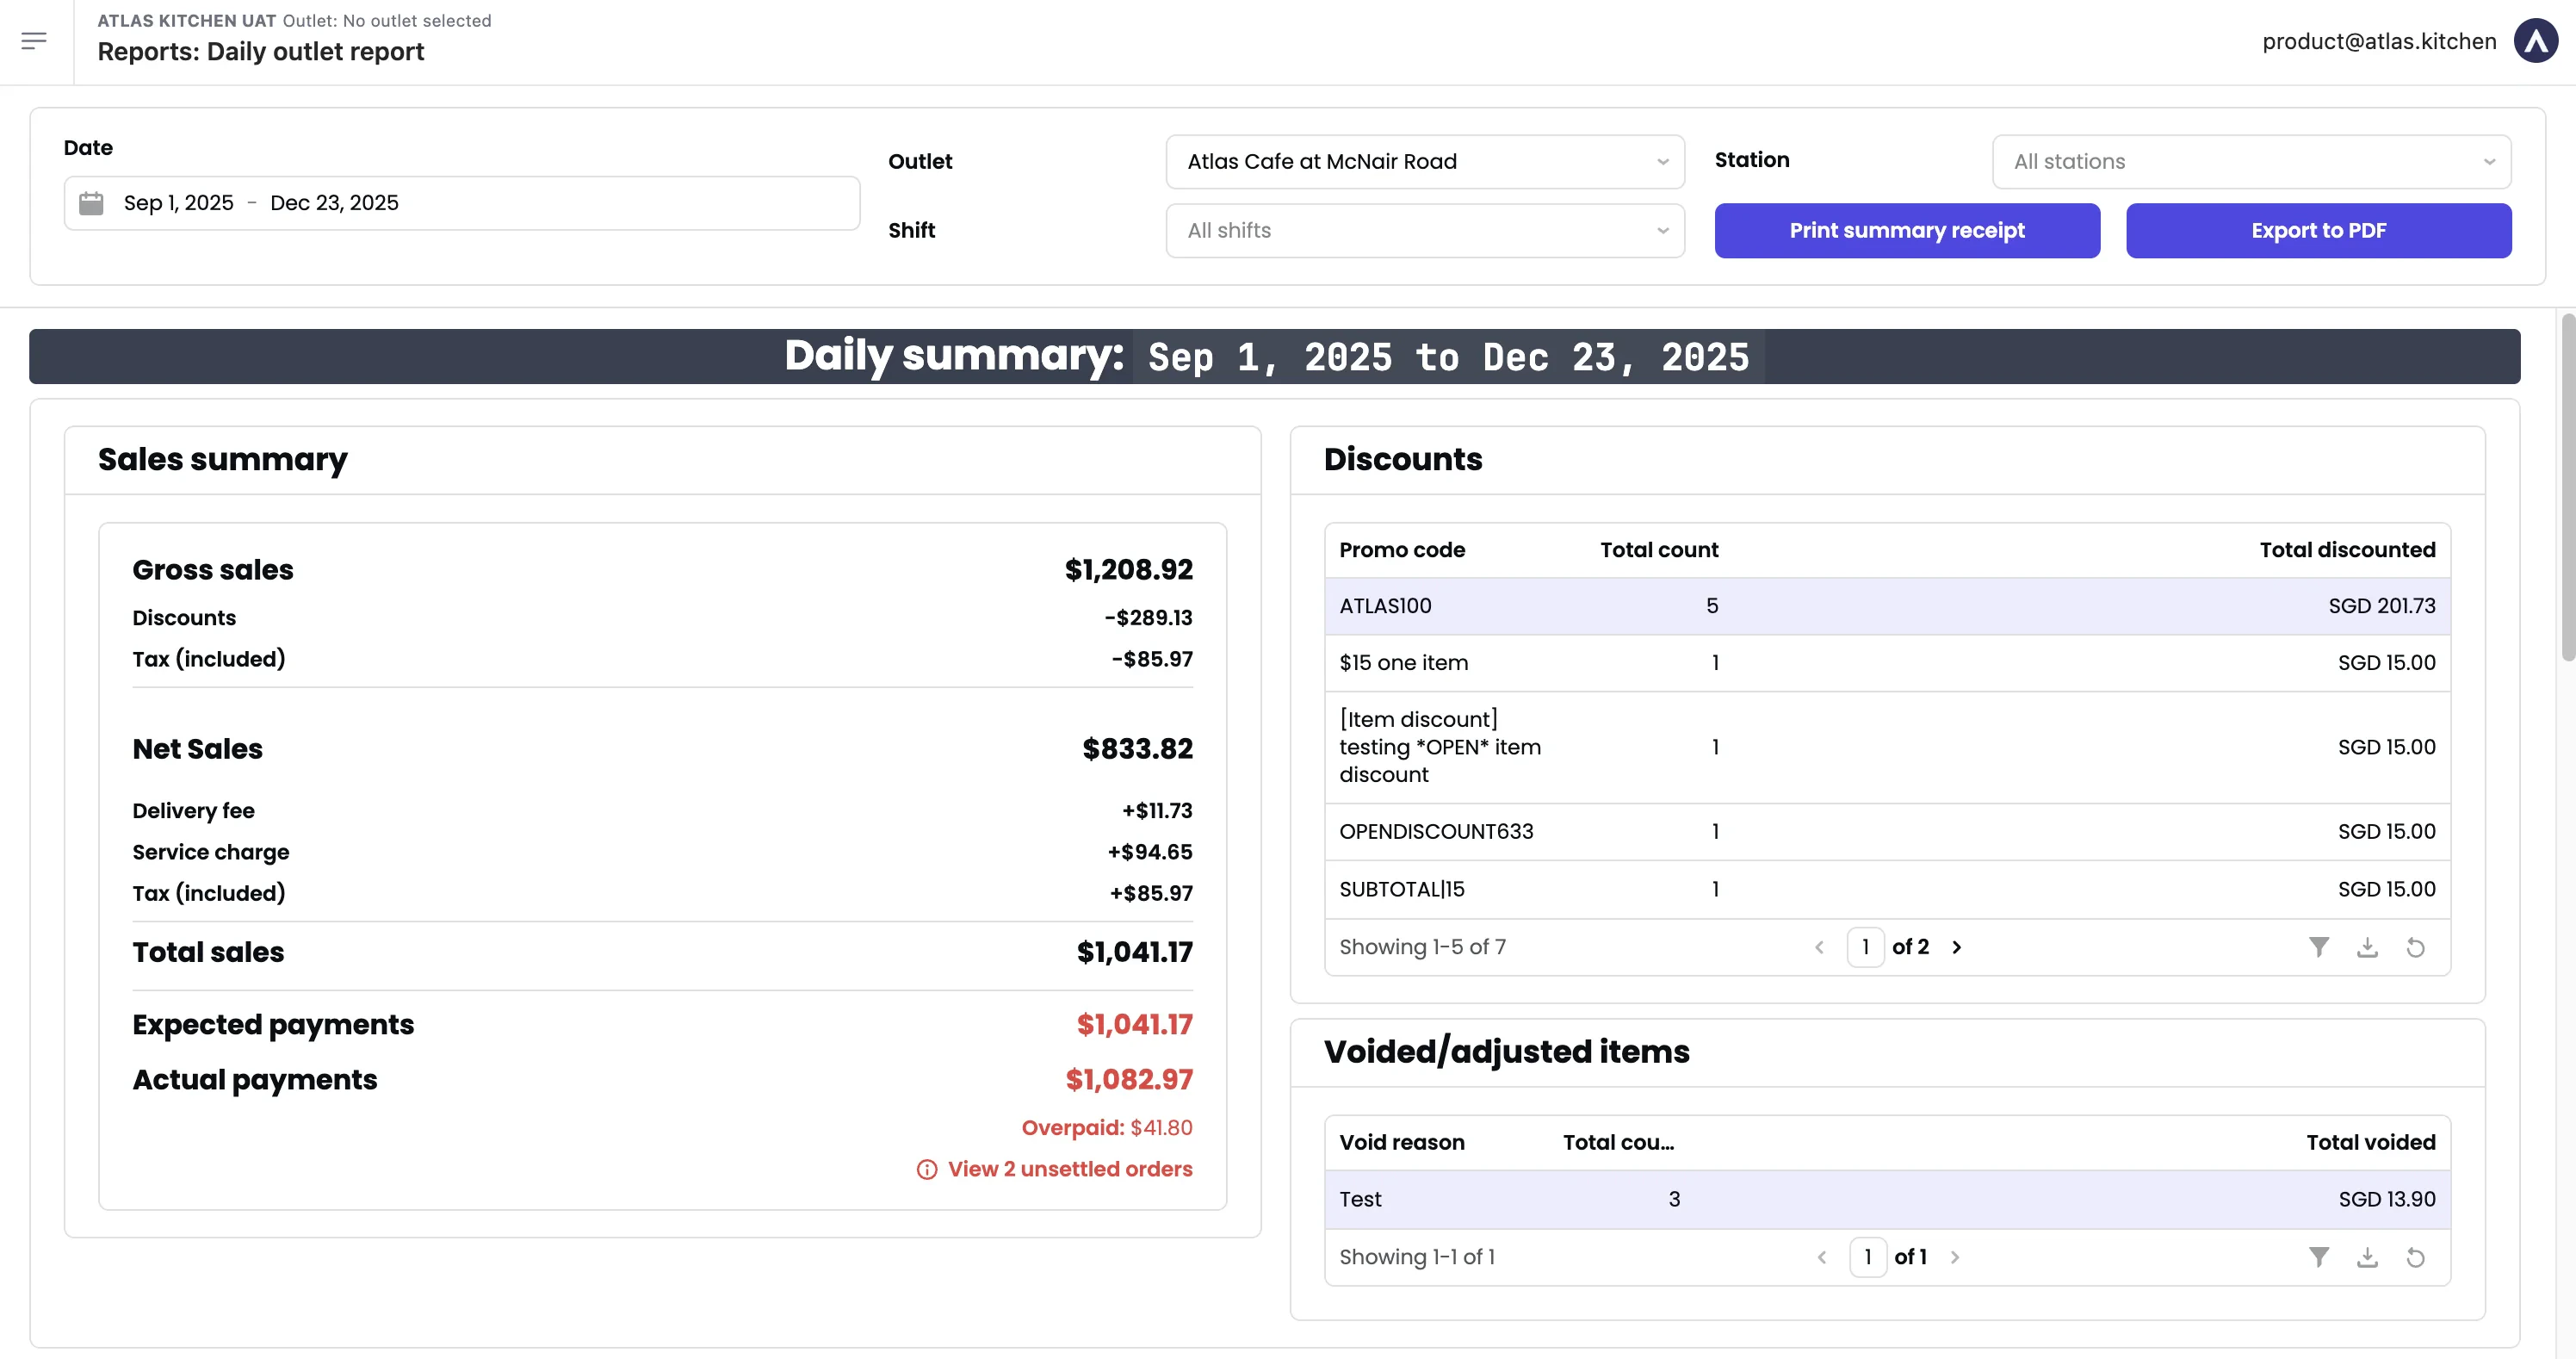
Filters

- Date — Serving date (when orders were fulfilled). Defaults to today.
- Start time / End time — Filter by time within the day.
- Outlet — Switch between outlets.
- Station — Filter by specific stations.
An outlet’s sales day defaults to 12AM-12AM. Contact support to customise (e.g., 3AM-3AM).
Sections
Sales summary
Key financial metrics for the selected period.Metric definitions
Metric definitions
- Gross sales — Undiscounted sales based on item prices. For tax-inclusive outlets, includes tax.
- Discounts — Total discounts (order and item-level).
- Points redeemed — Value of loyalty points redeemed.
- Tax (included) — Inclusive tax.
- Net sales — Gross sales - discounts - points redeemed - tax (included).
- Delivery fee — Delivery fees charged to customers.
- Surcharge — Surcharges (peak periods, packaging, etc.)
- Service charge — Service charge.
- Total sales — Net sales + delivery fee + surcharge + service charge.
- Platform delivery fee — Delivery fees from 3rd-party platforms (not your revenue).
- Platform discounts — Discounts sponsored by platforms (not deducted from your sales).
- Tips — Tips collected.
- Rounding — Rounding differences.
- Tax (excluded) — Exclusive tax.
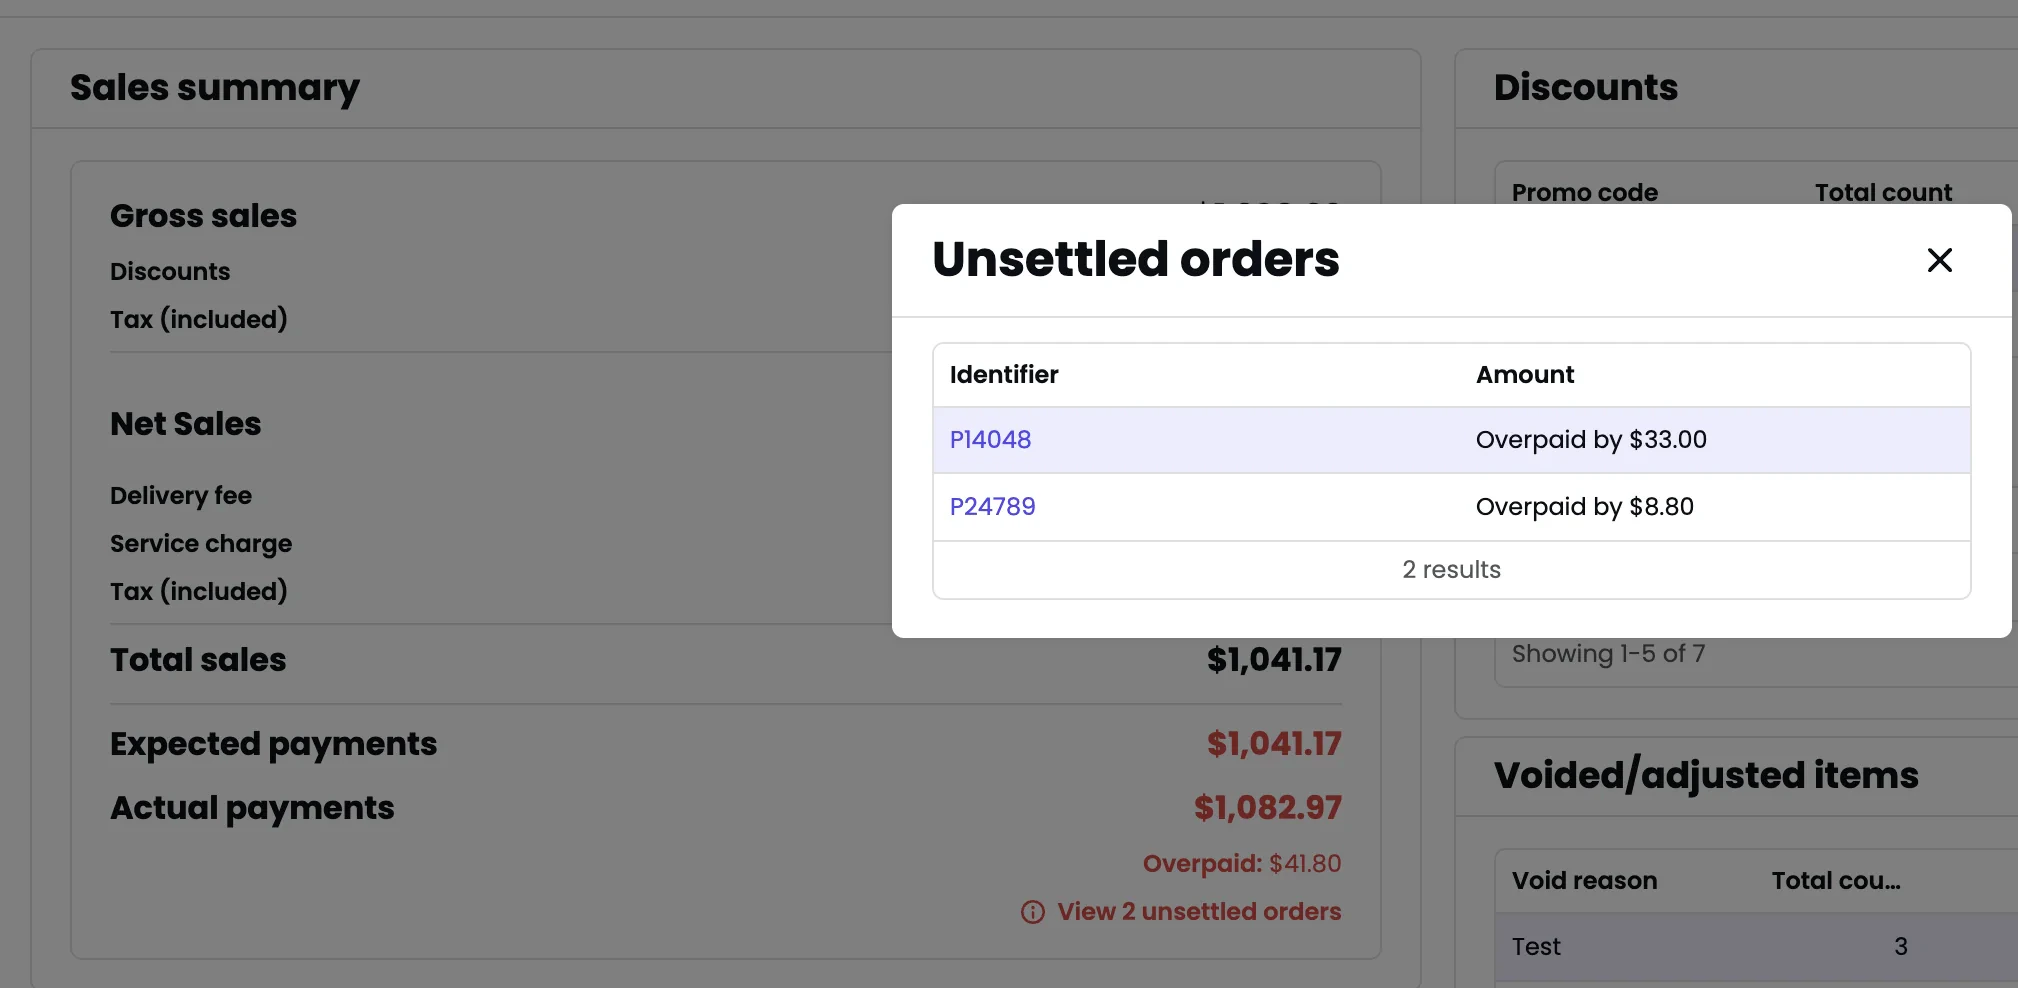
- Expected payments — What you should receive.
- Actual payments — What you actually received. If different, click “View unsettled orders” to investigate.
Discounts
Breakdown of discounts by promo code: name, count, and total discounted amount.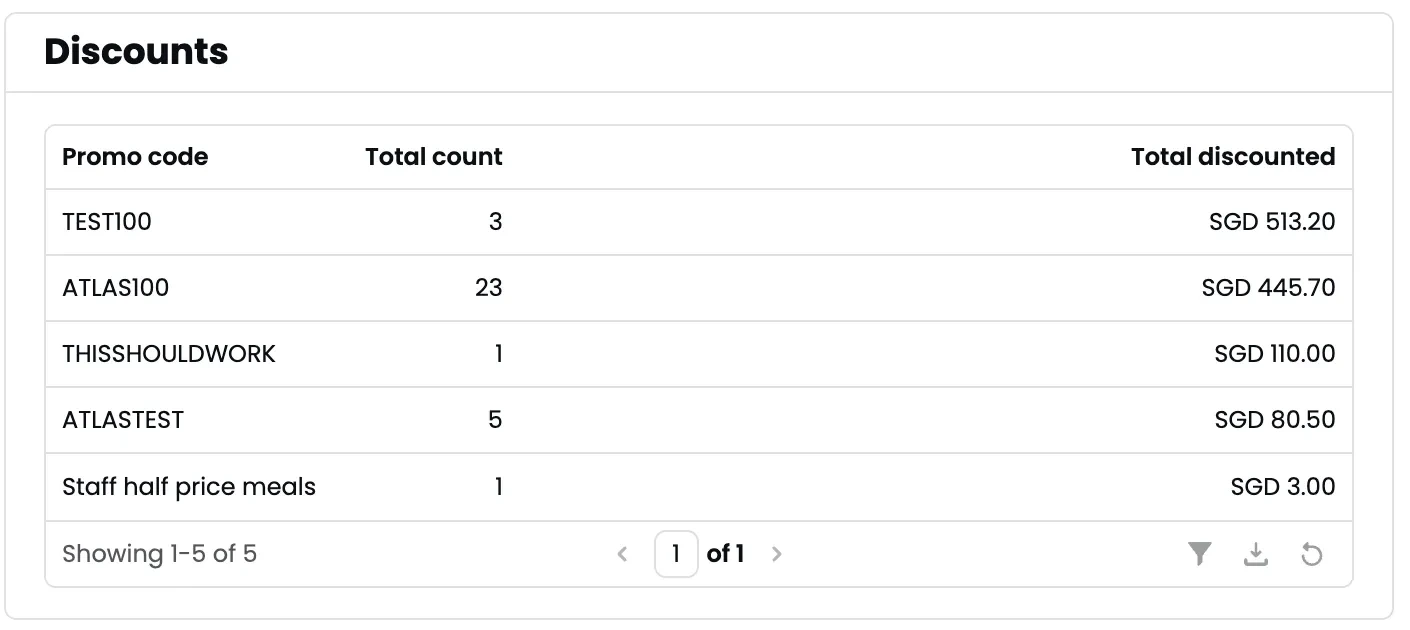
Voided/adjusted items
List of voided items grouped by void reason, with count and total value.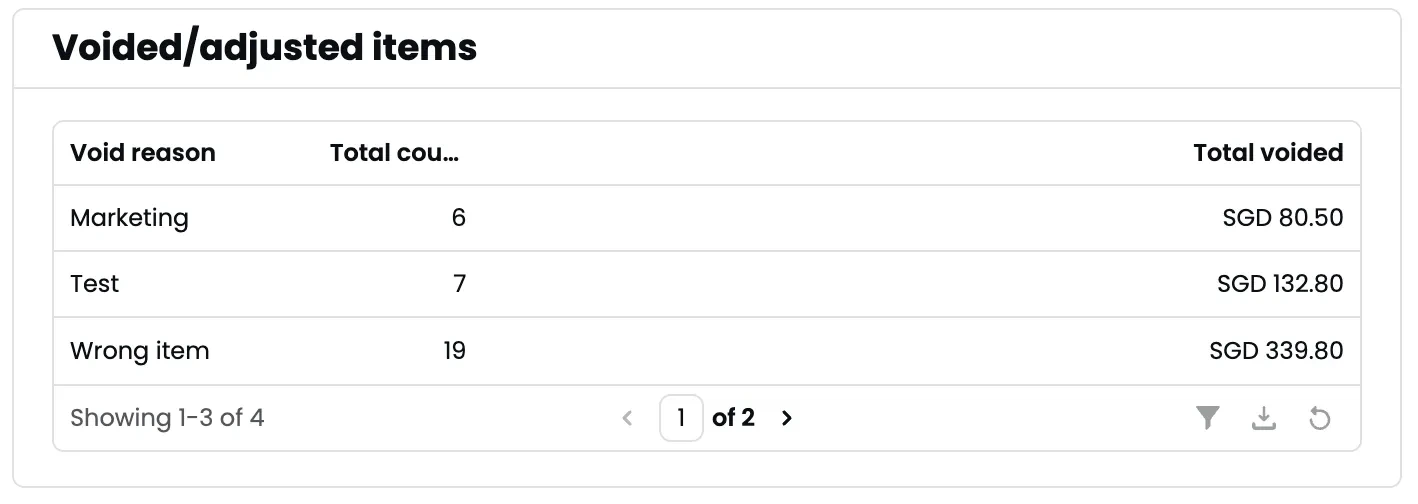
Sales by payment type
Payments and refunds by payment type: net payments, total paid, total refunded, and transaction count.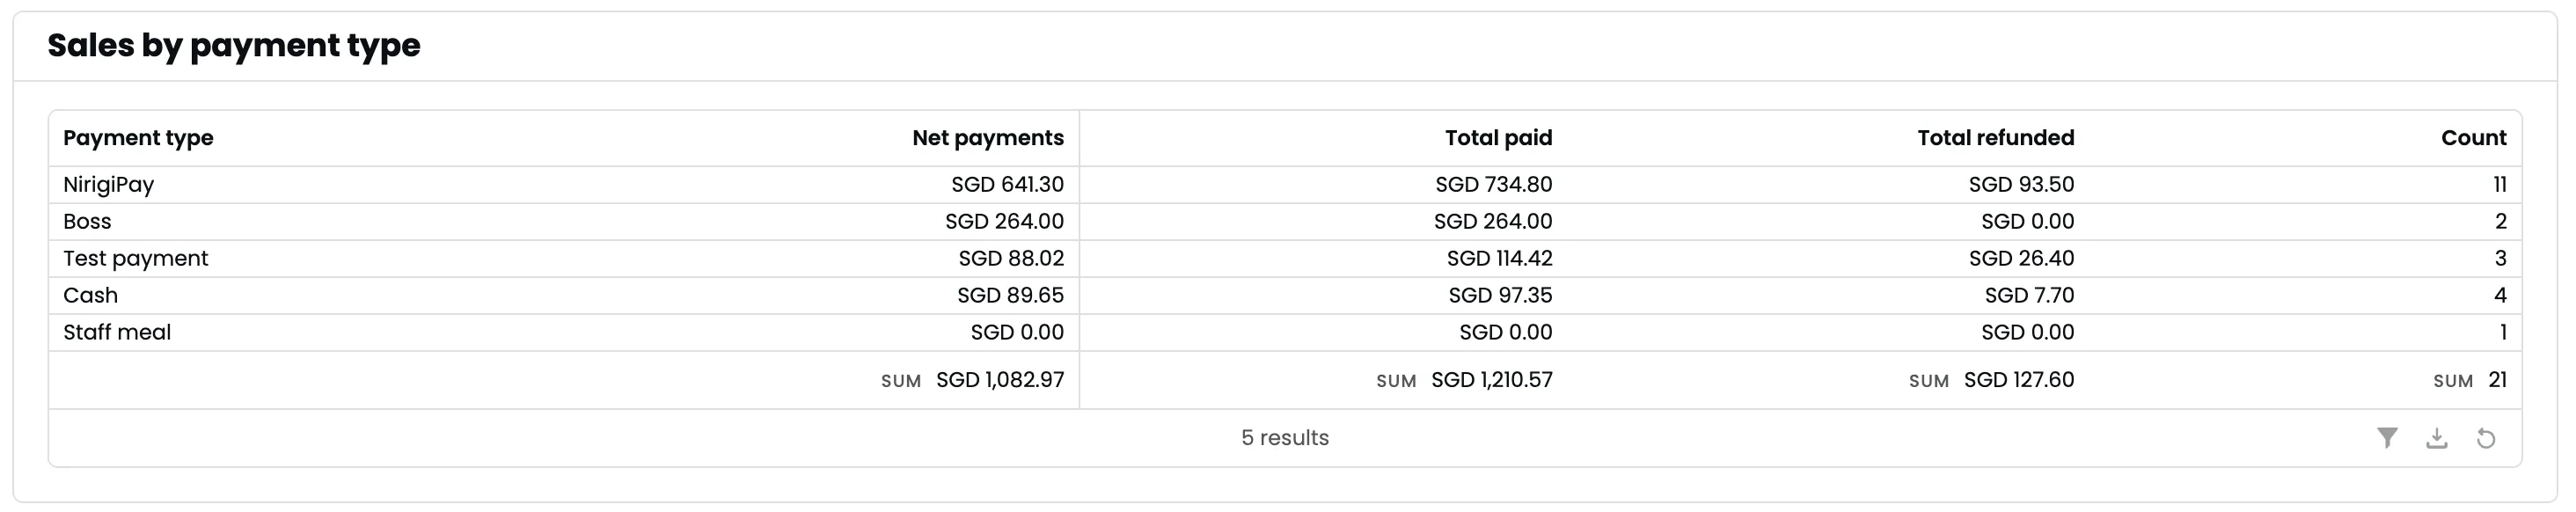
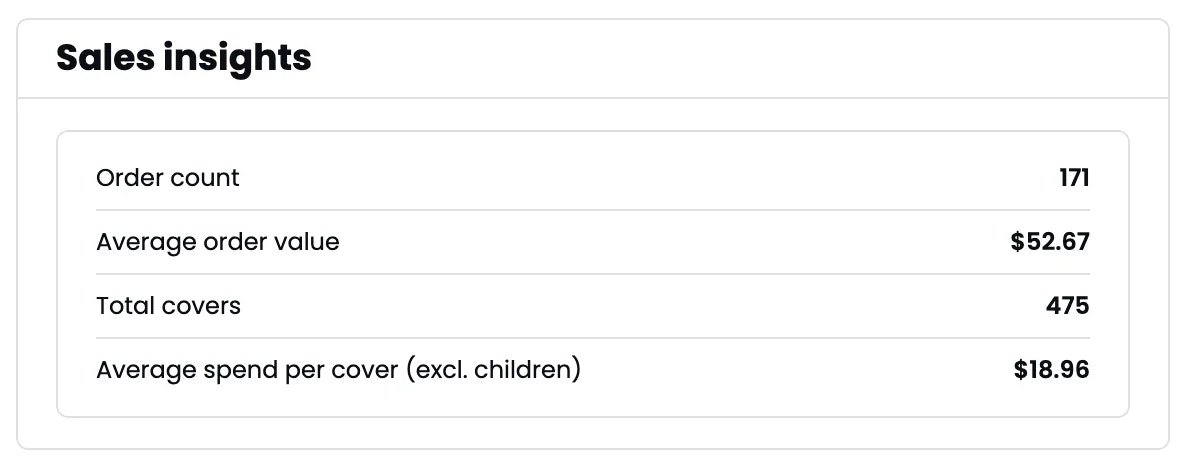
Daily insights
- Sales insights
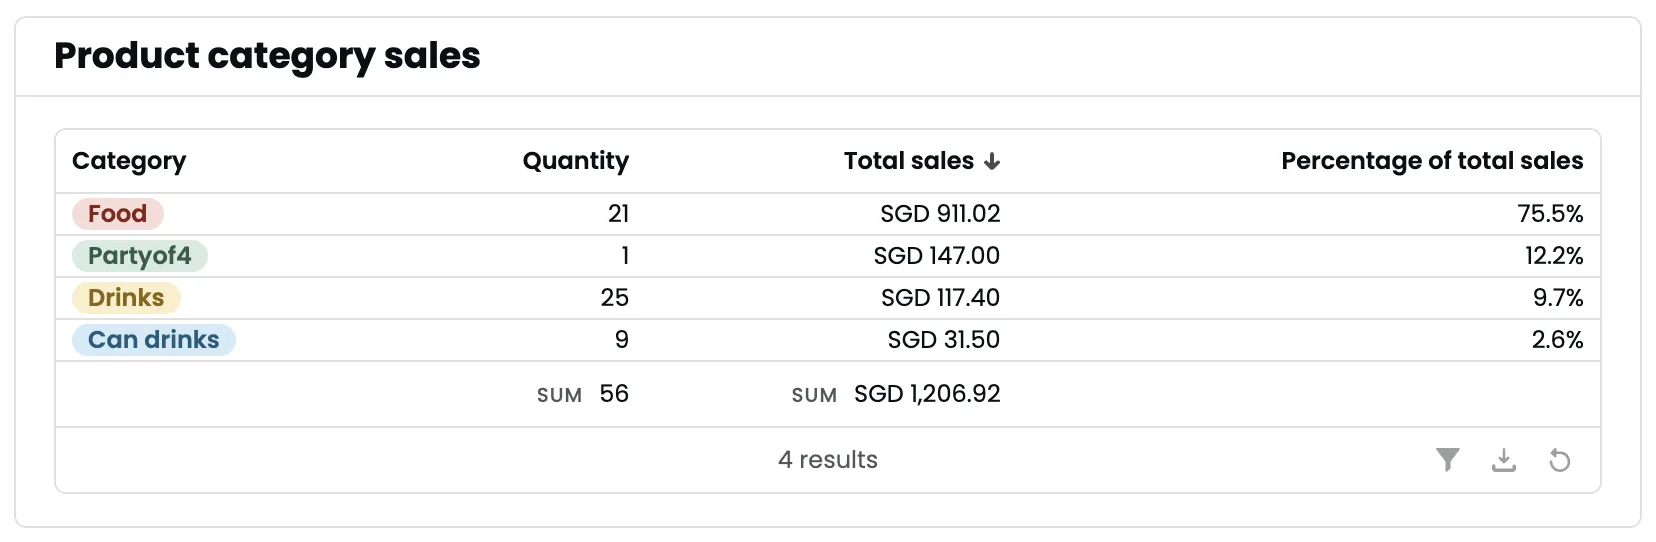
- Product category sales
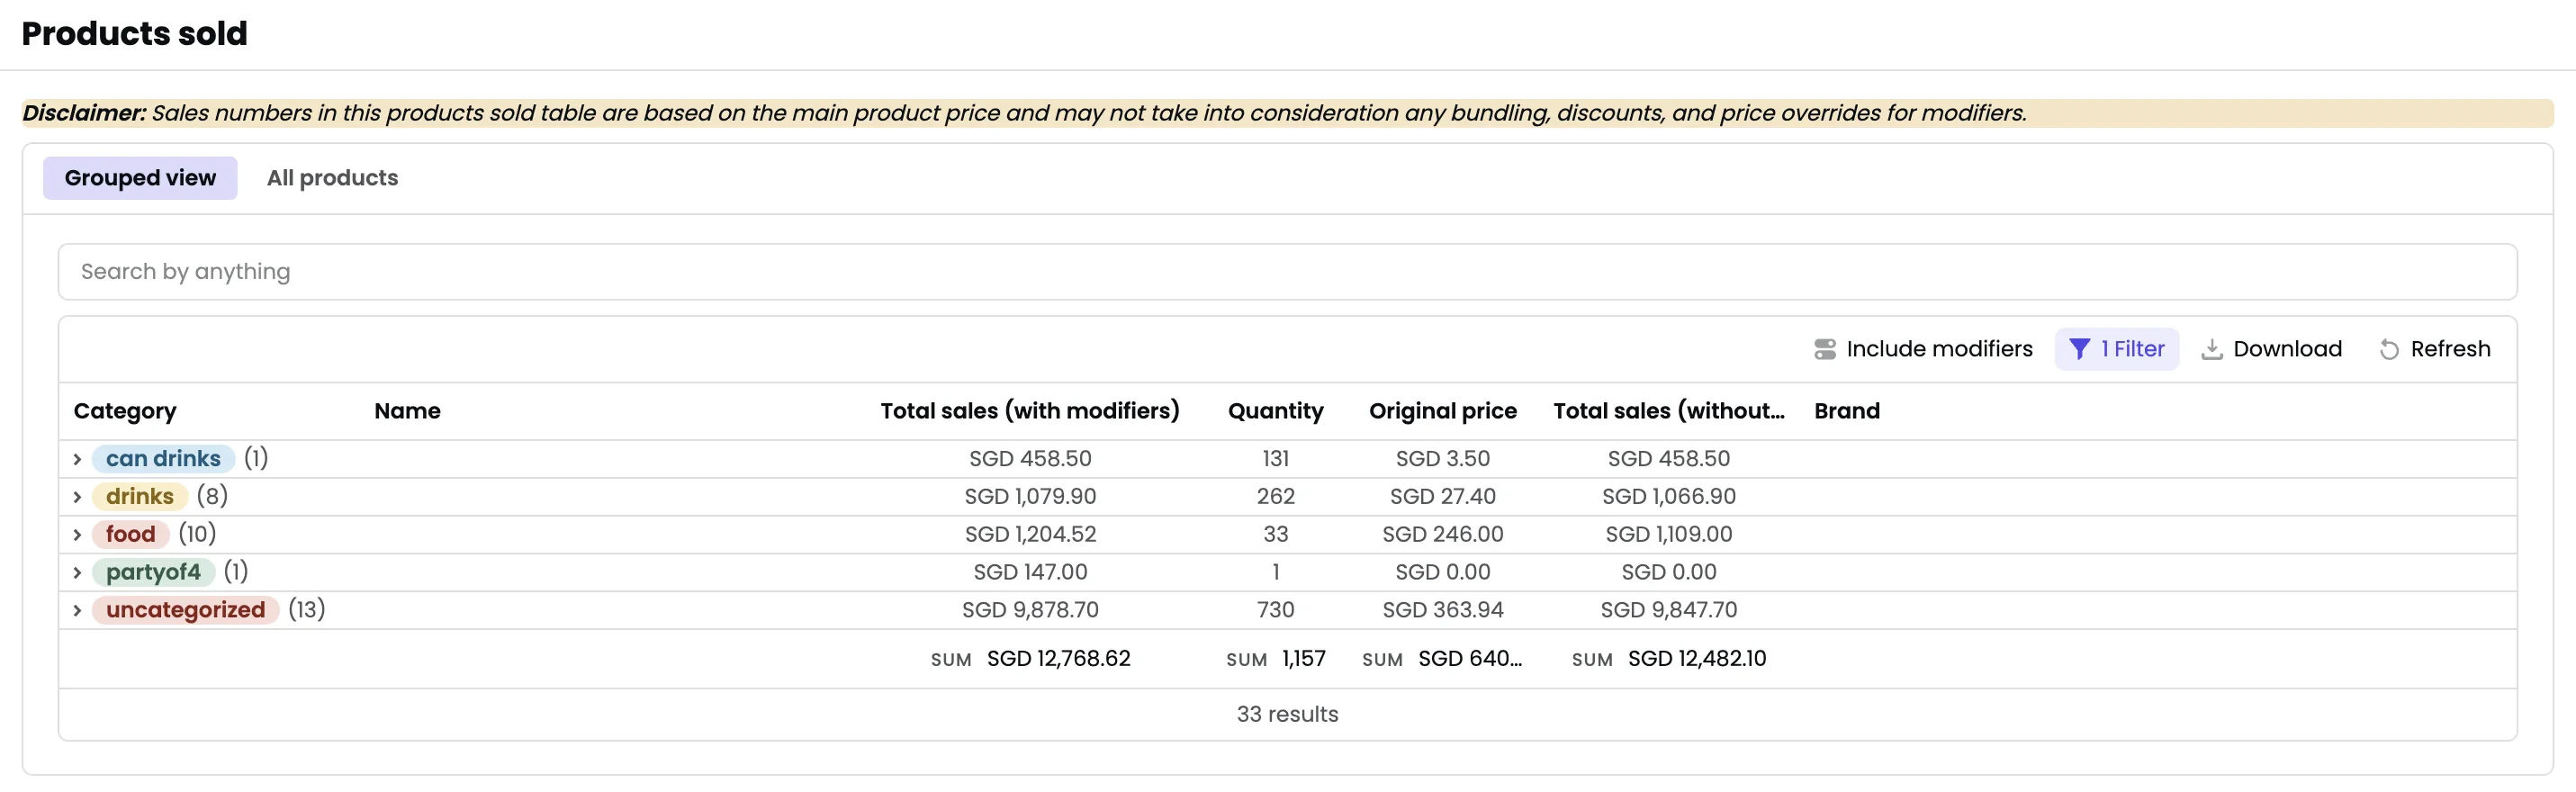
- Products sold
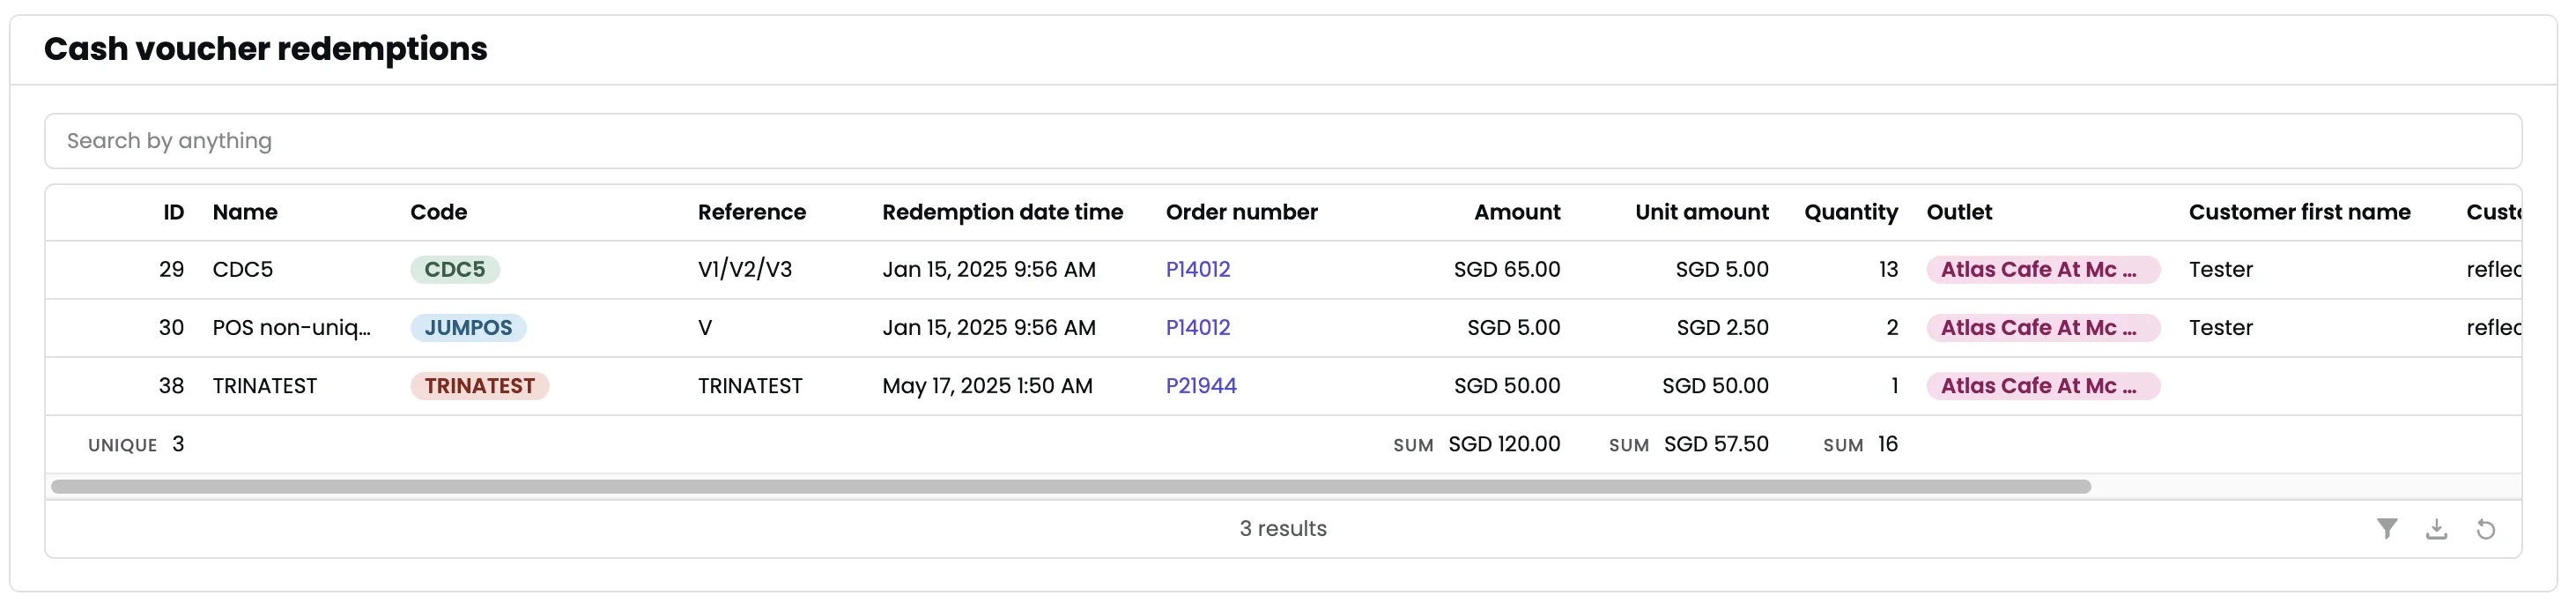
- Cash voucher redemptions
- Order count — Total orders.
- Average order value — Total sales ÷ order count.
- Total covers — Customers served.
- Average spend per cover — Total sales ÷ covers.
Exporting
- Print summary receipt — Print high-level metrics to a printer.
- Export to PDF — Export the entire report.