Who is this article for?
- Atlas users with Admin permissions. Set permissions from Settings > Team members.
- Restaurant managers and owners who need to track performance and make data-driven decisions.
Available for these roles:
Manager
Finance
Admin
This report is currently in Beta and only available to selected customers. Contact support if you’d like early access.
Overview
The sales summary report provides a detailed breakdown of your sales metrics with powerful filtering capabilities to analyze your data from multiple dimensions.Filters
Use filters to narrow down your sales data and focus on specific time periods, outlets, order sources, and more. Basic filters are displayed at the top of the report, with additional filters available by expanding the filter panel.
Sales summary report filters with multiple filtering options
New to Atlas reports? Read Using reports to learn how filters, downloads, drilldowns, and AI insights work across all reports.
Available filters
- Serving date/time: The time period when orders were fulfilled or served. Defaults to “in the past 7 complete days” but can be customized to any date range.
- Outlet(s): Filter by one or multiple outlets. Supports various filter operators including wildcard search. For example, you can use “contains atlas” to match all outlets with “atlas” in their name.
- Source: The ordering channel where orders originated. Options include point of sales, scan to order, kiosks, and other integrated ordering platforms.
- Fulfillment type: How the order was completed - dine-in, pickup, or delivery.
- Serving hour of day: Filter results by specific hours when orders were served. Useful for analyzing peak hours or comparing different time slots.
- Serving day of week: Filter by specific days of the week to identify patterns and trends across different days.
- Brand: Filter by brand if you operate multiple brands from your outlets.
- Order created date/time: When the order was originally created in the system. This differs from serving date/time, which represents when the order was fulfilled.
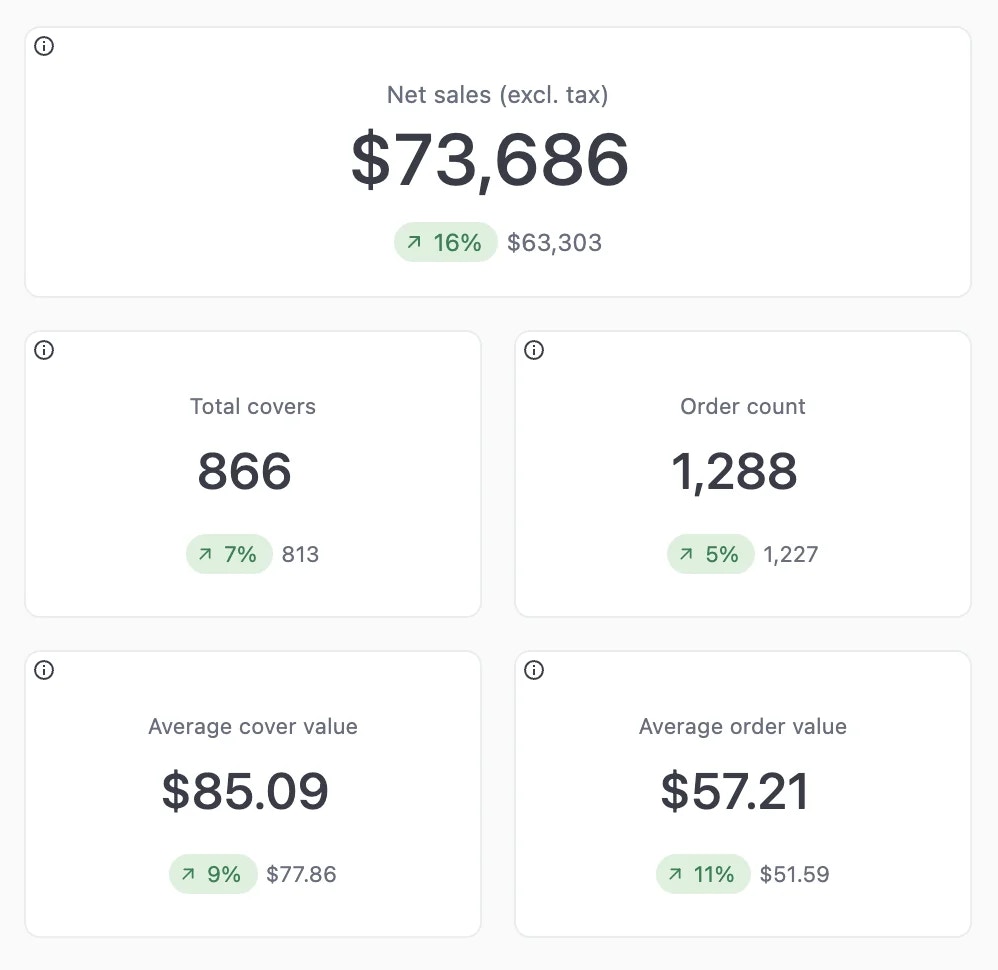
Key metrics
View critical sales performance indicators at a glance. Hover over the information icon next to each metric to see its exact definition.- Net sales: Total sales after discounts and adjustments
- Total covers: Number of customers served during the selected period
- Order count: Total number of orders completed
- Average cover value: Net sales divided by total covers
- Average order value: Net sales divided by order count
Key metrics
Sales summary
A comprehensive financial breakdown that shows the complete picture from gross sales down to final payments. This section works through your financial data step by step. The summary displays:- Gross sales: Total sales before any adjustments
- Discounts: All discounts applied to orders
- Net sales: Sales after discounts are applied
- Tax: Tax amounts collected (for tax-inclusive outlets, this is broken out from gross sales)
- Service charges and fees: Additional charges applied to orders
- Expected payment: The total amount that should have been collected
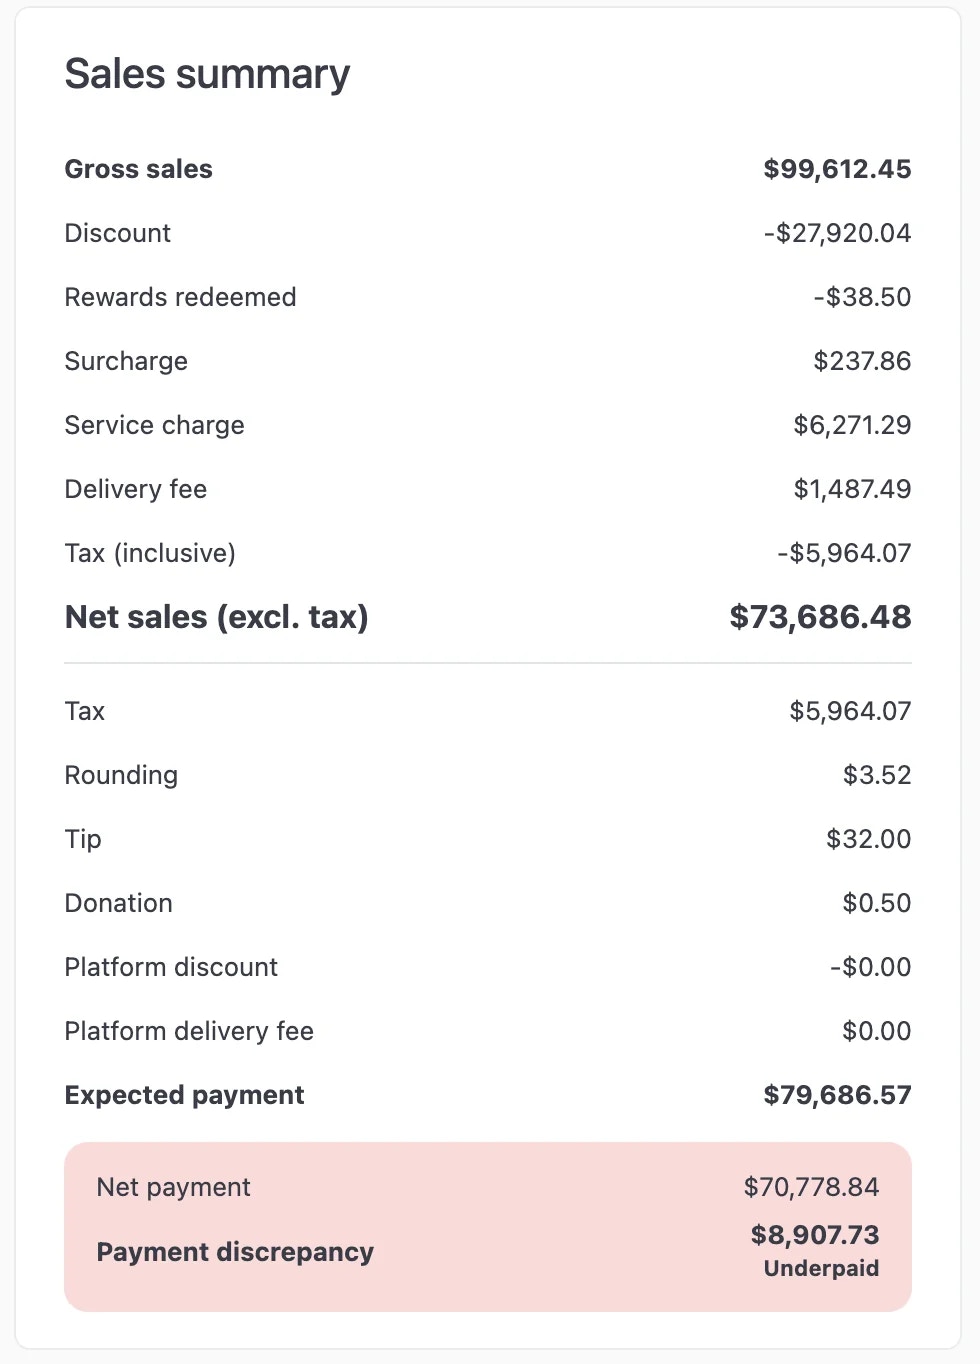
Sales summary
Payment discrepancy tracking
At the bottom of the summary, you’ll see:- Net payment: Actual payments received minus refunds
- Payment discrepancy: Difference between expected payment and net payment
- Overpayment on orders (customer paid more than the order total)
- Underpayment on orders (customer paid less than the order total)
- Order details: Which orders have payment issues
- Clickable order links: Click any order to view details and rectify the discrepancy
Payment discrepancy summary
Net payment is calculated as total payments received minus any refunds issued during the selected period.
AI-generated insights
The report includes AI-generated insights based on your sales data. These insights automatically identify trends, patterns, and notable changes in your business performance to help you make informed decisions.Sales analytics
Net sales by day
View your daily net sales broken down by fulfillment type (dine-in, pickup, delivery). This chart helps you:- Track day-to-day sales performance
- Identify trends across different fulfillment channels
- Compare fulfillment type performance over time
Net sales by day of week
Analyze which days of the week generate the strongest sales. Use this chart to:- Identify your busiest and slowest days
- Plan staffing and inventory accordingly
- Spot weekly patterns in customer behavior
Net sales by hour of day
Understand your peak and off-peak hours with hourly sales breakdowns. This visualization shows:- High-traffic hours when sales are strongest
- Low-traffic periods that may benefit from promotions
- Hourly patterns to optimize operations and scheduling
Detailed data tables
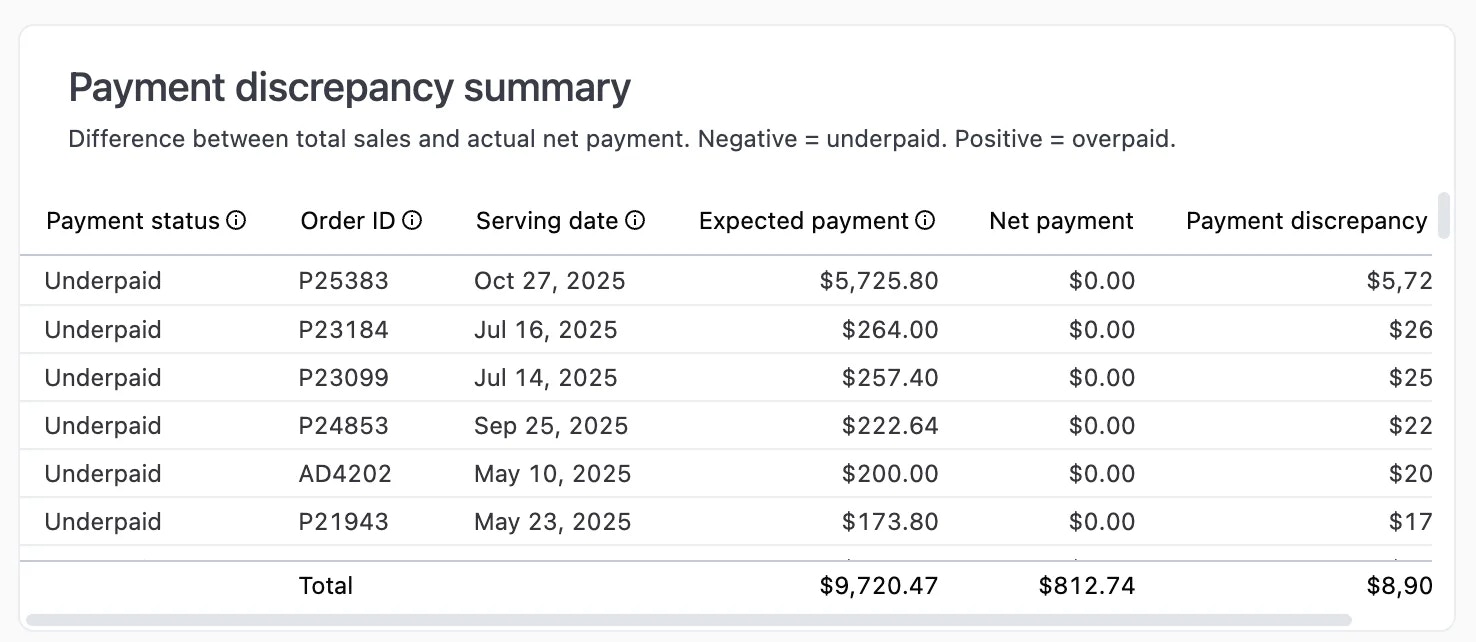
The following sections provide detailed tabular breakdowns of your sales data across various dimensions.Payment discrepancy summary table
Track orders where payment received doesn’t match the expected amount. This table helps identify underpaid or overpaid orders that require investigation.Payment discrepancy summary showing underpaid orders
- Payment status: Whether the order is underpaid or overpaid
- Order ID: Clickable link to view the full order details and investigate the issue
- Serving date: Date when the order was fulfilled
- Expected payment: Amount that should have been collected based on the order total
- Net payment: Actual amount received
- Payment discrepancy: Difference between expected and actual payment
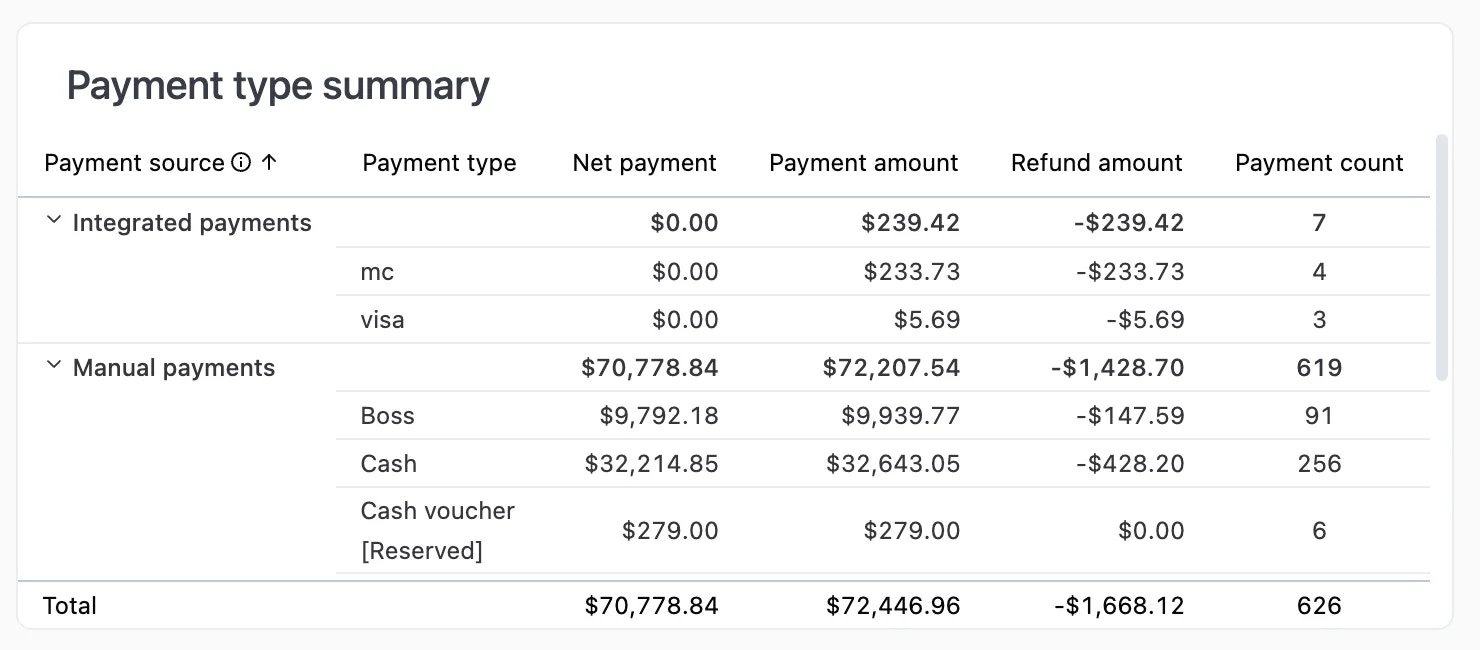
Payment type summary
Overview of payment methods used by customers, split into two main categories: integrated payments and manual payments.- Integrated payments: Payments processed through Atlas’s integrated payment terminals and payment methods
- Manual payments: Manually created payment types that you can use to track custom payments for your business
Payment type summary with integrated and manual payment breakdown
- Payment type: Name of the payment method
- Net payment: Total payment amount received
- Payment amount: Gross payment amount before refunds
- Refund amount: Total amount refunded (displayed as negative)
- Payment count: Number of transactions using this payment method
Outlet summary
View sales performance across all your outlets. This table allows you to compare performance between different locations.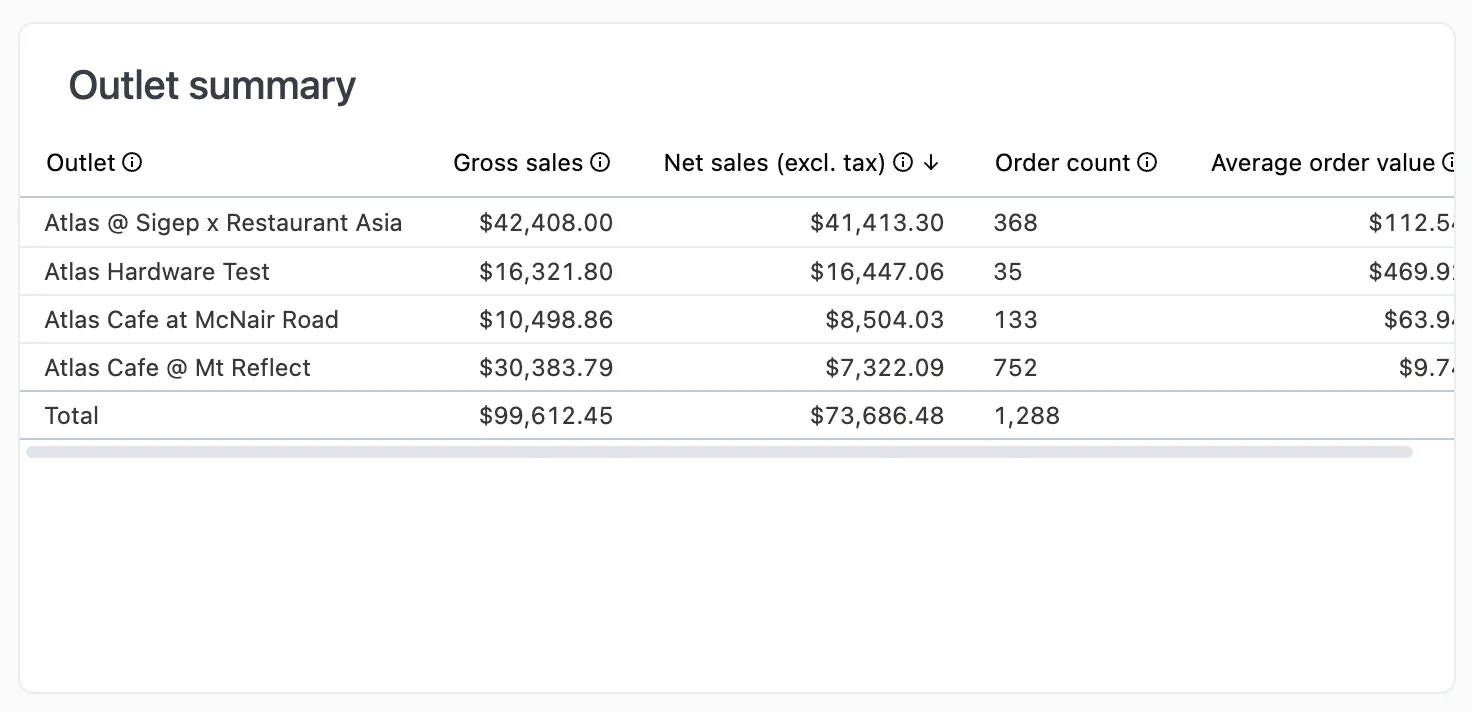
Outlet summary showing sales metrics by location
- Outlet: Name of each outlet location
- Gross sales: Total sales before discounts and adjustments
- Net sales (excl. tax): Sales after discounts and excluding tax
- Order count: Total number of orders fulfilled
- Average order value: Net sales divided by order count
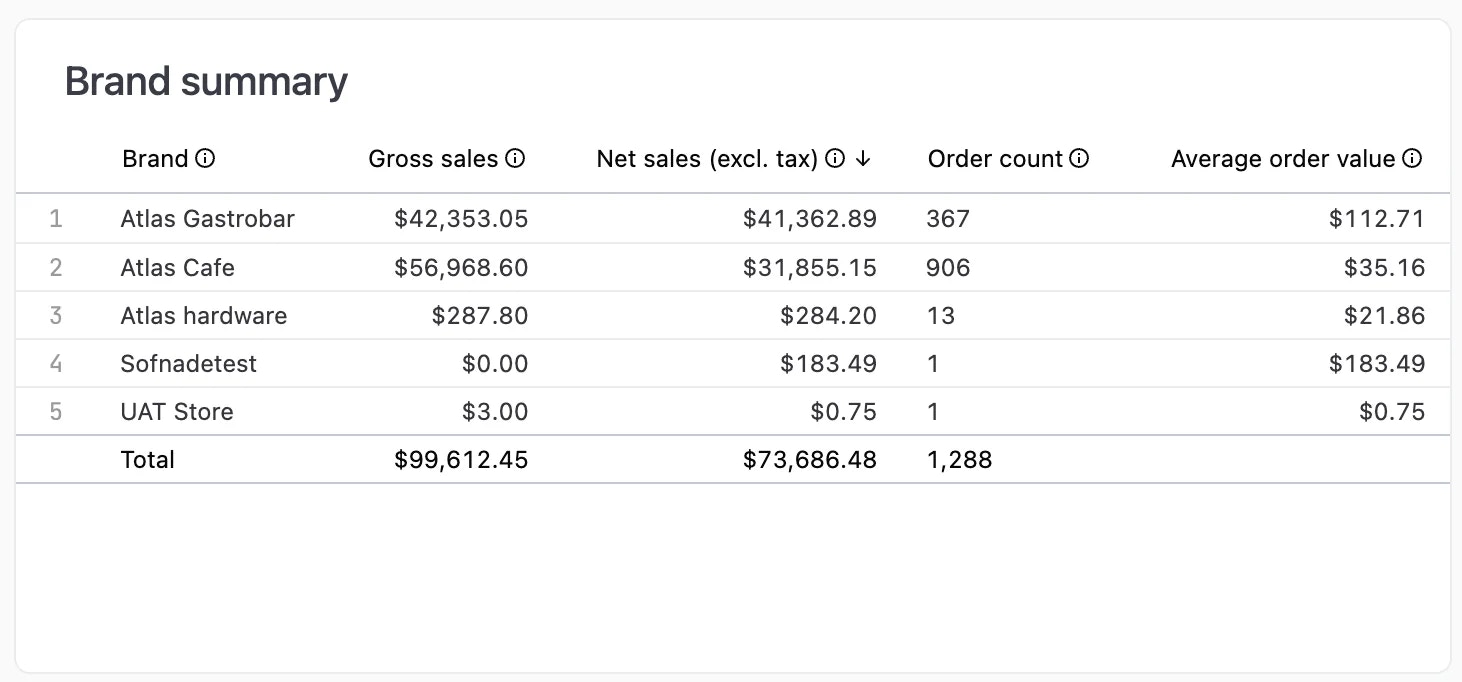
Brand summary
Analyze sales performance by brand. Useful for multi-brand operators to understand which brands are performing best. Metrics include:- Brand: Name of each brand
- Gross sales: Total sales before discounts and adjustments
- Net sales (excl. tax): Sales after discounts and excluding tax
- Order count: Total number of orders
- Average order value: Net sales divided by order count
Brand summary
Discount summary
Track the performance and usage of promotional codes and discounts. Use this table to evaluate which promotions are most effective.
Discount summary
- Promo code: Name of the discount or promotional code
- Order count: Number of times the discount was applied
- Discount: Total amount discounted across all uses
Fulfillment type summary
Break down sales by how orders were fulfilled (pickup, delivery, dine-in, etc.).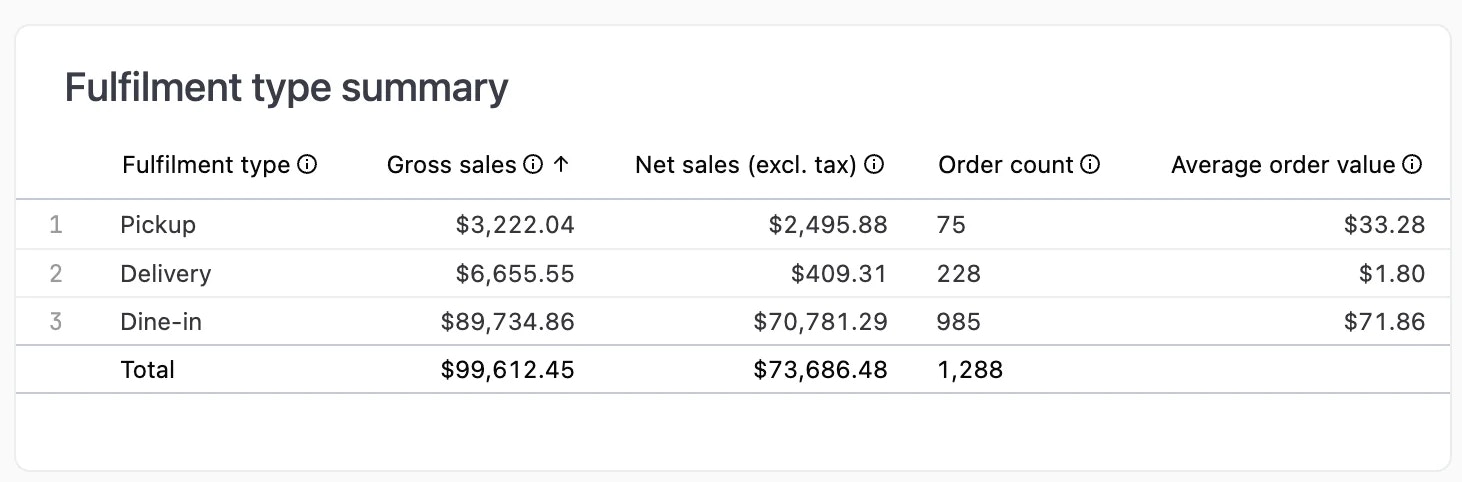
Fulfilment type summary
- Fulfillment type: Method of order fulfillment (Pickup, Delivery, Dine-in)
- Gross sales: Total sales for this fulfillment type
- Net sales (excl. tax): Sales after discounts and excluding tax
- Order count: Number of orders
- Average order value: Net sales divided by order count
Source summary
Analyze sales by order source to understand which channels drive the most revenue.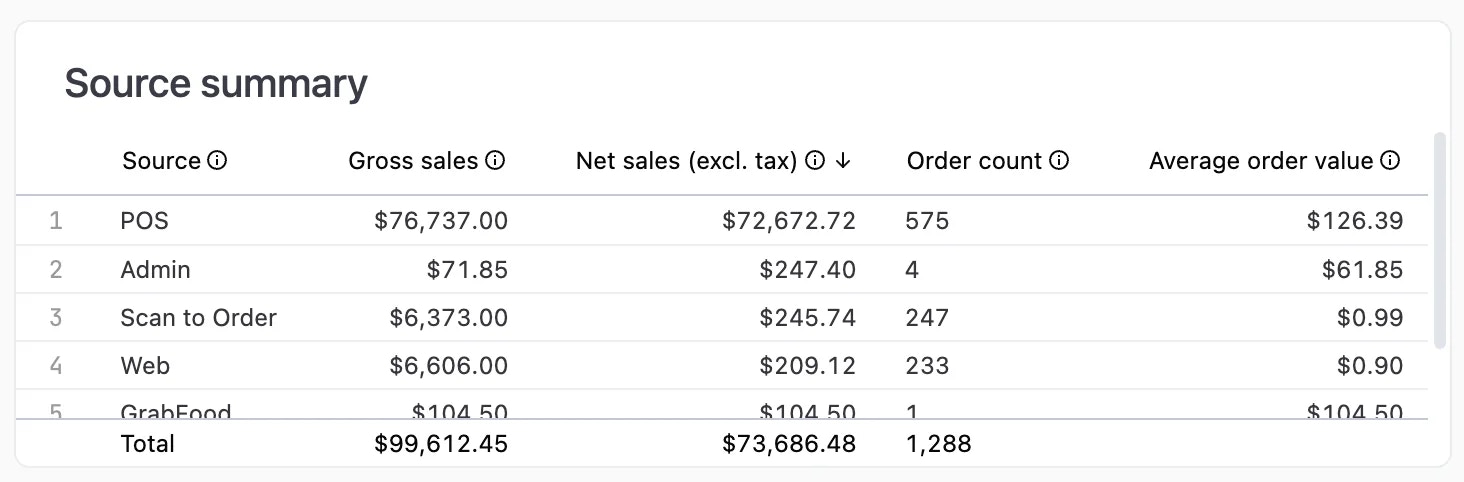
Source summary
- Source: Where the order originated (POS, Admin, Scan to Order, Web, GrabFood, etc.)
- Gross sales: Total sales from this source
- Net sales (excl. tax): Sales after discounts and excluding tax
- Order count: Number of orders from this source
- Average order value: Net sales divided by order count
Item category summary
Detailed breakdown of product sales organized by reporting category. This powerful table allows you to analyze sales at both the category and individual item level.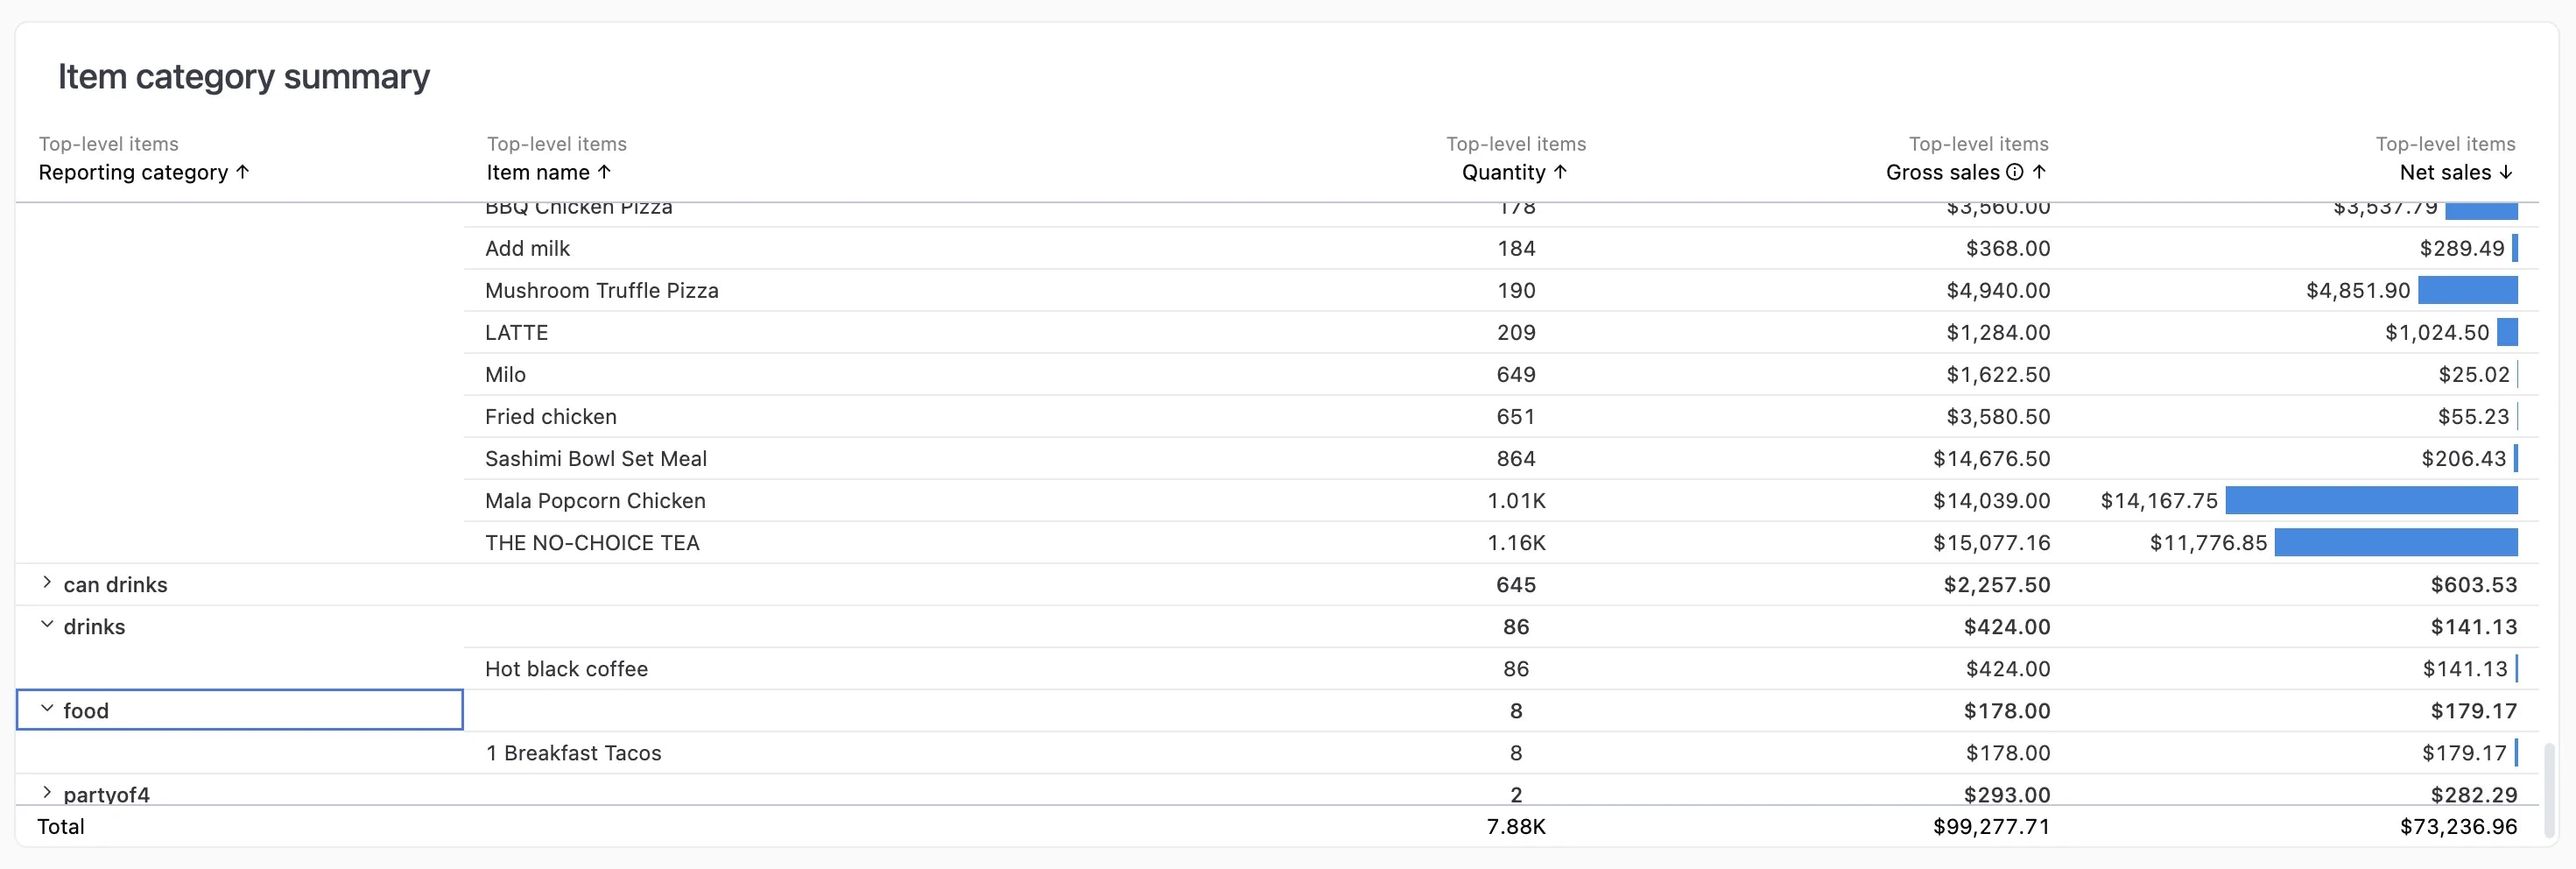
Item category summary with top-level items and modifiers
Top-level view
The main table displays:- Reporting category: Product category (set on the Products page)
- Item name: Individual products within each category
- Quantity: Number of items sold
- Gross sales: Total sales for the item
- Net sales: Sales after discounts and adjustments
To set up your product categories, edit your product on the Products page and set its Reporting category.
Single product view with modifiers
Click on any item name to expand and see a breakdown of modifiers that were applied to that product. This shows you which modifier combinations are most popular. For example, clicking on “Value Lunch Set” reveals all the modifier selections customers made (drink choices, side dishes, add-ons, etc.) along with their sales impact.Disclaimer: Sales numbers in the item category summary are based on the main product price and may not take into consideration any bundling, discounts, and price overrides for modifiers.
Drill-down functionality
One of the most powerful features of the sales summary report is the ability to drill down into specific metrics to see the individual orders that make up that number.
Drill-down view showing modifier breakdown for Sashimi Bowl Set Meal
When drilling down on item category metrics, you can view “Mid-level items” which shows the modifier breakdown for bundled or combo products like “Sashimi Bowl Set Meal” with its component items (Tekka Don, Miso soup, etc.).