> ## Documentation Index
> Fetch the complete documentation index at: https://help.atlas.kitchen/llms.txt
> Use this file to discover all available pages before exploring further.
# Sales trends
> Track sales performance over time with period comparisons and breakdowns.
**Available for:** Manager Finance Admin
[Go to report →](https://portal.atlas.kitchen/analytics/sales-trends)
## What this report shows
Track how your sales are trending over time. Compare current performance against previous periods and see daily patterns across different dimensions.
## Filters
 * **Serving date/time** — When orders were fulfilled. Defaults to the past 7 complete days.
* **Serving date granularity** — Group data by date, week, month, quarter, or year.
* **Outlet(s)** — Filter by one or multiple outlets.
* **Order created date/time** — When the order was created.
* **Brand** — Filter by brand.
* **Source** — Where orders came from (POS, scan to order, kiosk, etc.)
* **Fulfilment type** — Dine-in, pickup, or delivery.
* **Serving hour of day** — Filter by specific hours.
* **Serving day of week** — Filter by specific days.
## Sections
### Month-to-date sales
Current month's net sales compared to:
* **Last MTD** — Same period last month
* **Last year MTD** — Same period last year
### Week-to-date sales
Current week's net sales compared to:
* **Last WTD** — Same period last week
* **4 weeks ago WTD** — Same period 4 weeks ago
* **Serving date/time** — When orders were fulfilled. Defaults to the past 7 complete days.
* **Serving date granularity** — Group data by date, week, month, quarter, or year.
* **Outlet(s)** — Filter by one or multiple outlets.
* **Order created date/time** — When the order was created.
* **Brand** — Filter by brand.
* **Source** — Where orders came from (POS, scan to order, kiosk, etc.)
* **Fulfilment type** — Dine-in, pickup, or delivery.
* **Serving hour of day** — Filter by specific hours.
* **Serving day of week** — Filter by specific days.
## Sections
### Month-to-date sales
Current month's net sales compared to:
* **Last MTD** — Same period last month
* **Last year MTD** — Same period last year
### Week-to-date sales
Current week's net sales compared to:
* **Last WTD** — Same period last week
* **4 weeks ago WTD** — Same period 4 weeks ago
 ### Metrics for period
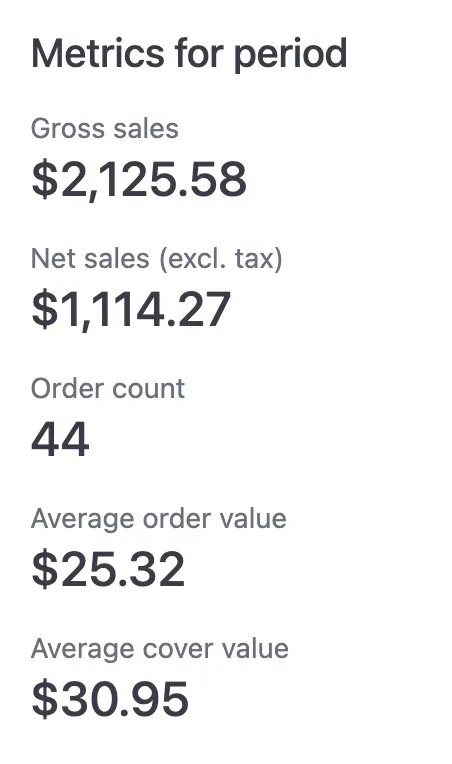
Summary metrics for your selected date range:
* **Gross sales** — Total sales before discounts and tax
* **Net sales (excl. tax)** — Sales after discounts, excluding tax
* **Order count** — Total number of orders
* **Average order value** — Net sales divided by order count
* **Average cover value** — Net sales divided by total covers
### Metrics for period
Summary metrics for your selected date range:
* **Gross sales** — Total sales before discounts and tax
* **Net sales (excl. tax)** — Sales after discounts, excluding tax
* **Order count** — Total number of orders
* **Average order value** — Net sales divided by order count
* **Average cover value** — Net sales divided by total covers
 ### Daily sales and order count
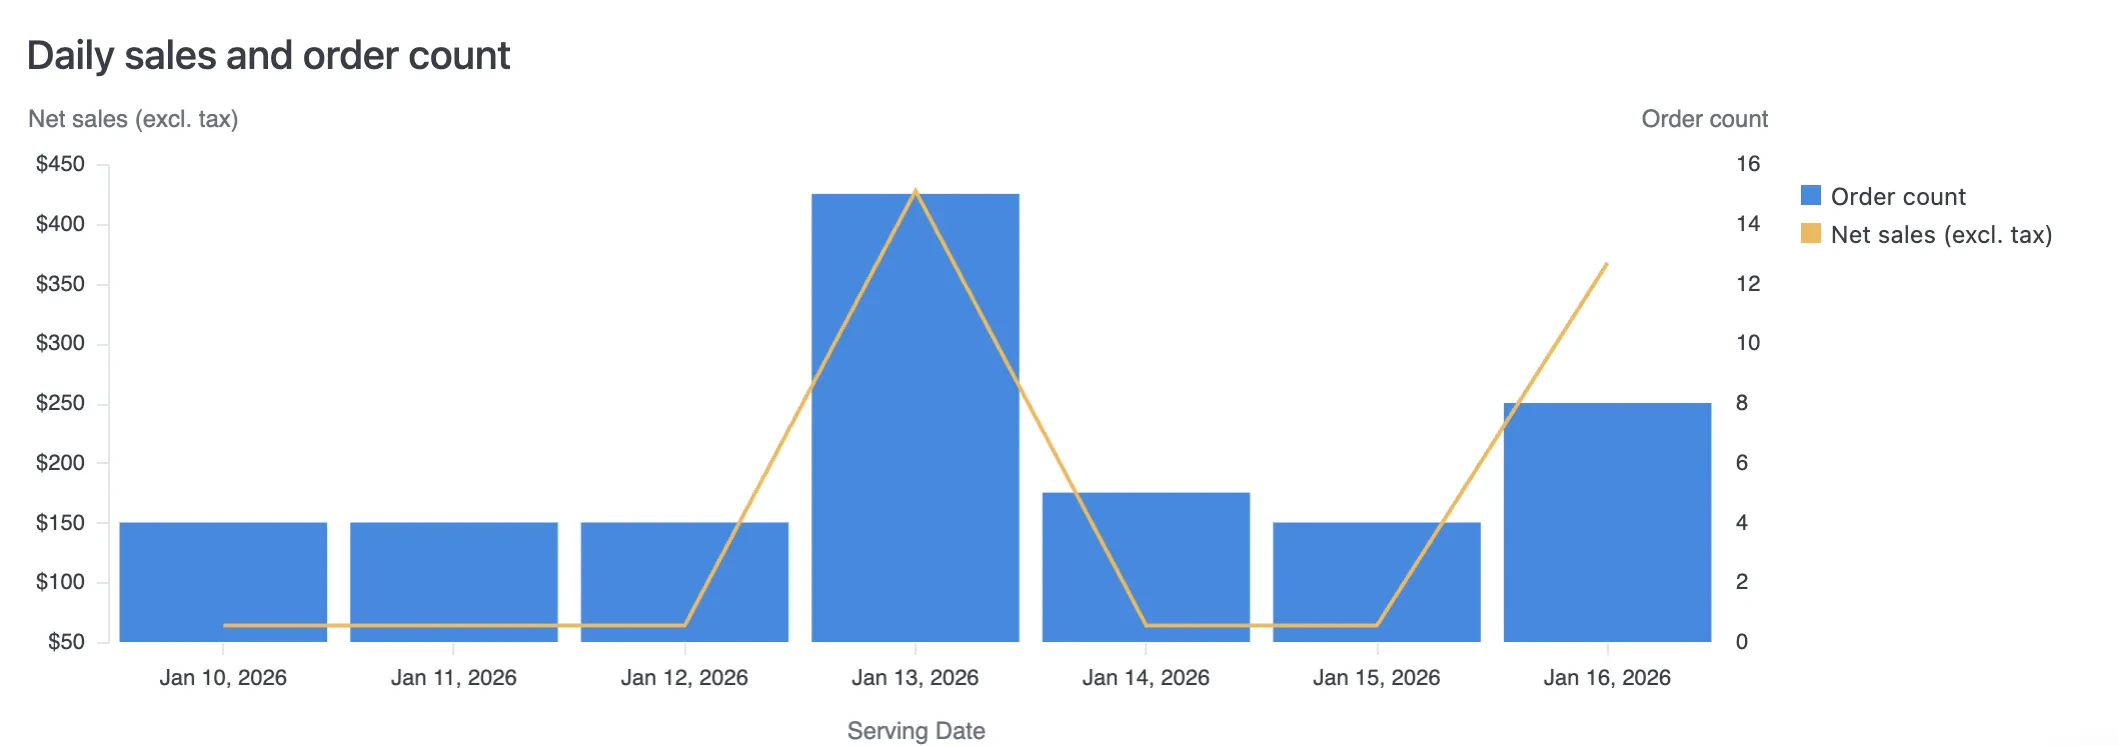
A combined chart showing:
* **Order count** (blue bars) — Number of orders per day
* **Net sales** (orange line) — Net sales excluding tax per day
### Daily sales and order count
A combined chart showing:
* **Order count** (blue bars) — Number of orders per day
* **Net sales** (orange line) — Net sales excluding tax per day
 ### Breakdown by source
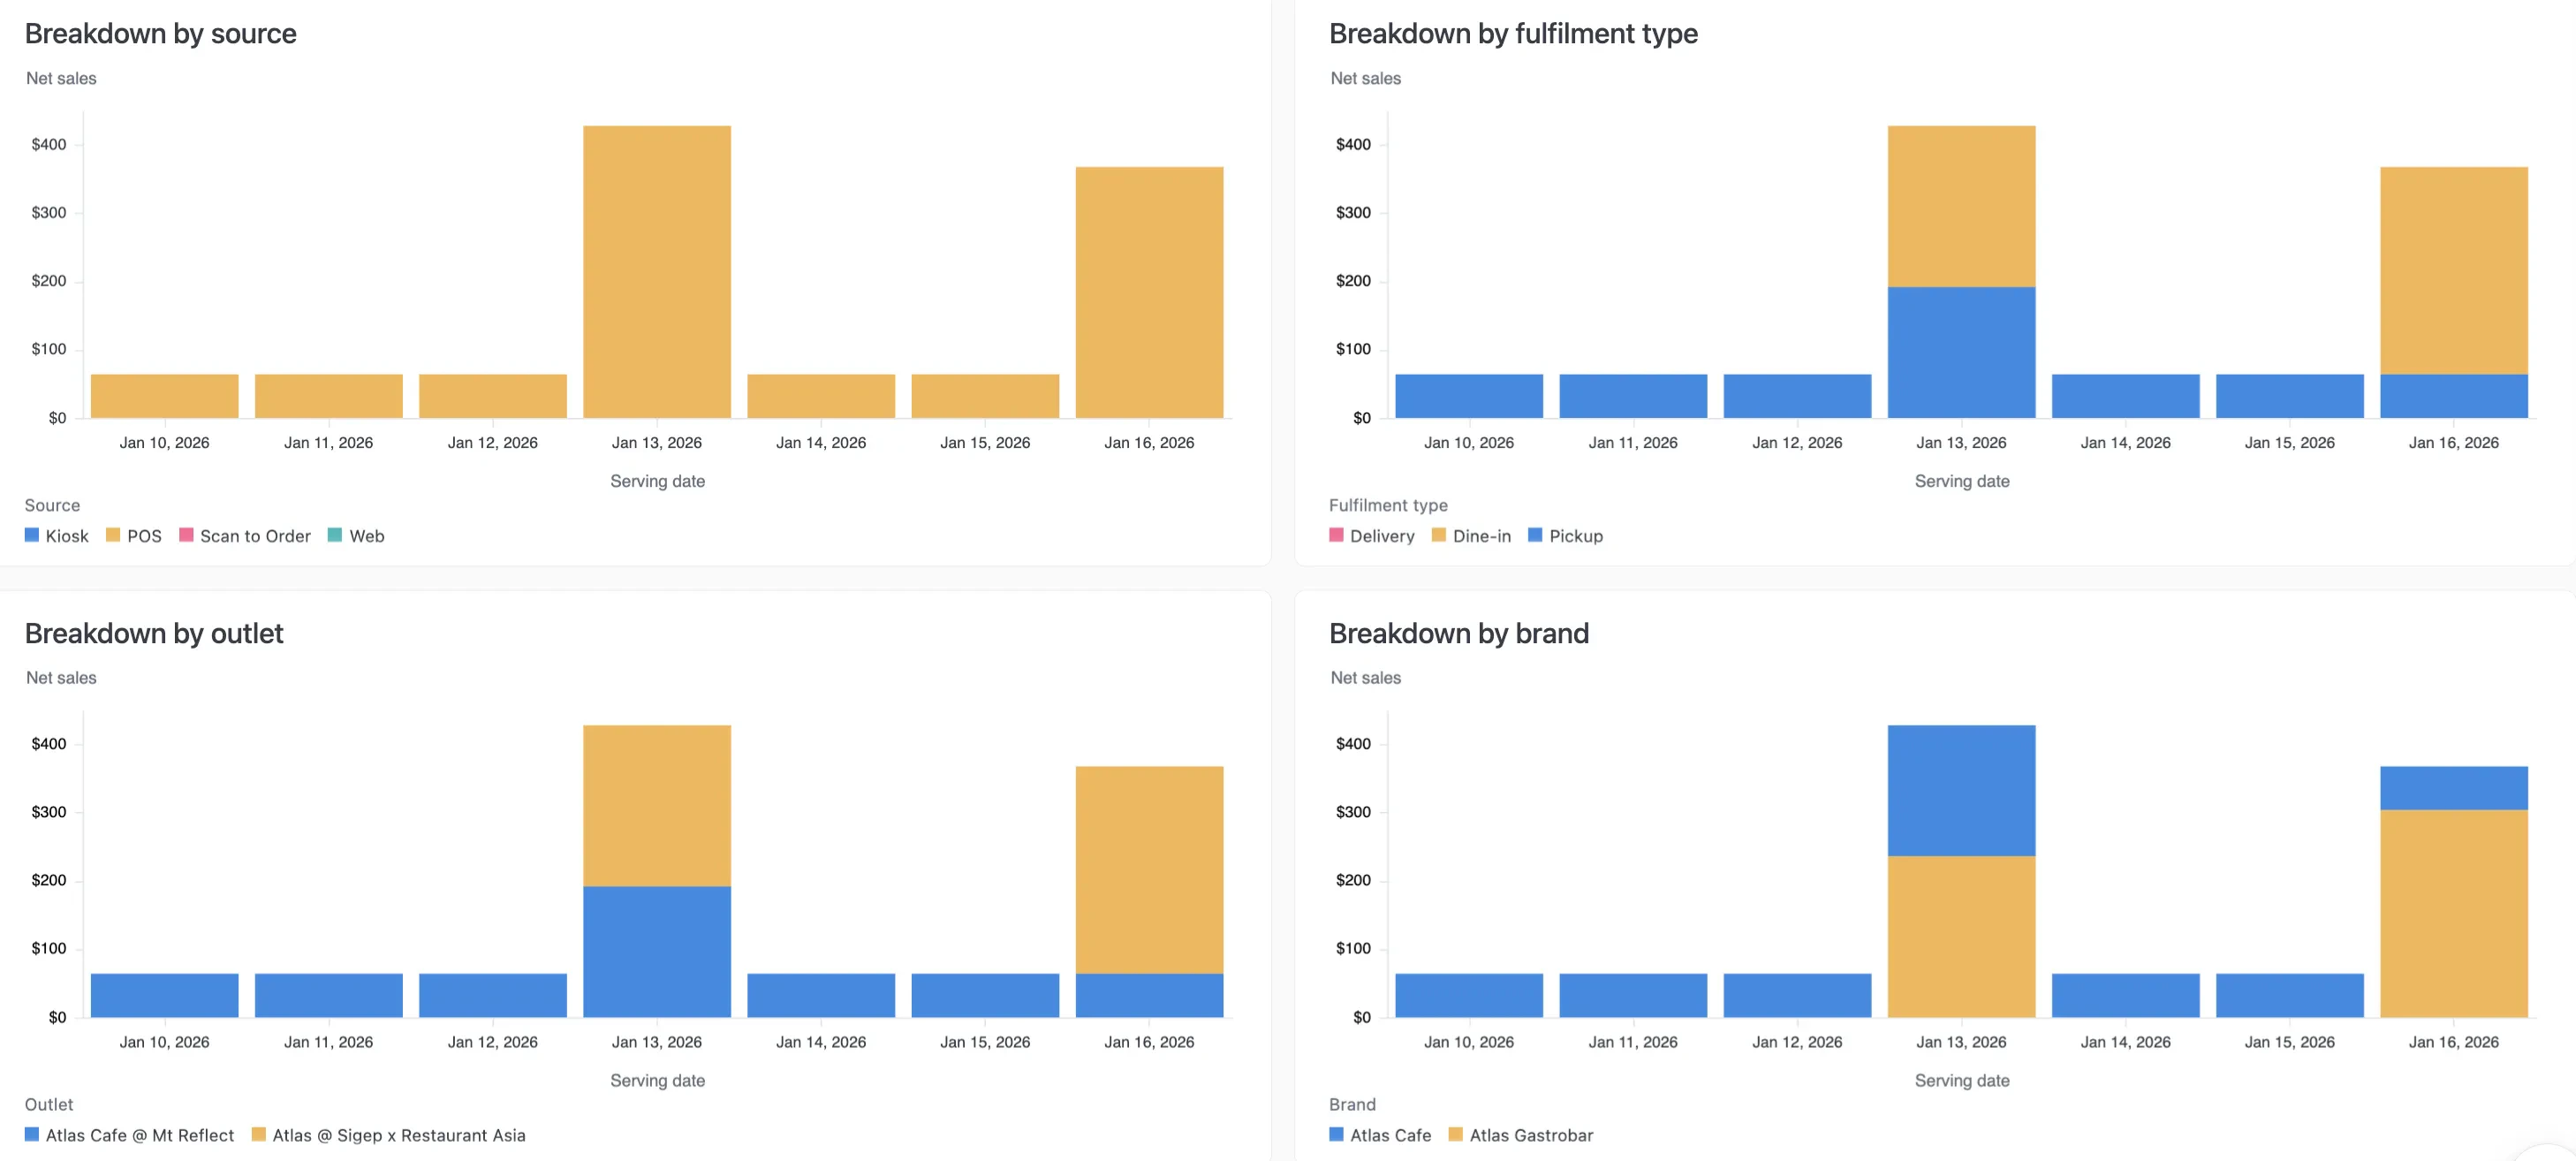
Daily net sales stacked by order source (e.g., Kiosk, POS, Scan to Order, Web).
### Breakdown by fulfilment type
Daily net sales stacked by fulfilment type (Delivery, Dine-in, Pickup).
### Breakdown by outlet
Daily net sales stacked by outlet. Useful for comparing location performance over time.
### Breakdown by brand
Daily net sales stacked by brand. Useful for multi-brand operators.
### Breakdown by source
Daily net sales stacked by order source (e.g., Kiosk, POS, Scan to Order, Web).
### Breakdown by fulfilment type
Daily net sales stacked by fulfilment type (Delivery, Dine-in, Pickup).
### Breakdown by outlet
Daily net sales stacked by outlet. Useful for comparing location performance over time.
### Breakdown by brand
Daily net sales stacked by brand. Useful for multi-brand operators.