> ## Documentation Index
> Fetch the complete documentation index at: https://help.atlas.kitchen/llms.txt
> Use this file to discover all available pages before exploring further.
# Sales summary report
> Detailed breakdown of sales metrics including payments, discounts, and category performance.
**Available for:** Manager Finance Admin
[Go to report →](https://portal.atlas.kitchen/analytics/sales-summary)
## What this report shows
A comprehensive breakdown of your sales performance. Track net sales, payment discrepancies, discounts, and see how sales split across outlets, brands, fulfilment types, and product categories.
## Filters
 * **Serving date/time** — When orders were fulfilled. Defaults to the past 7 days.
* **Outlet(s)** — Filter by one or multiple outlets. Supports wildcard search (e.g., "contains atlas").
* **Source** — Where orders came from (POS, scan to order, kiosk, etc.)
* **Fulfilment type** — Dine-in, pickup, or delivery
* **Serving hour of day** — Filter by specific hours
* **Serving day of week** — Filter by specific days
* **Brand** — Filter by brand if you operate multiple brands
* **Order created date/time** — When the order was created (different from serving time)
## Sections
### Key metrics
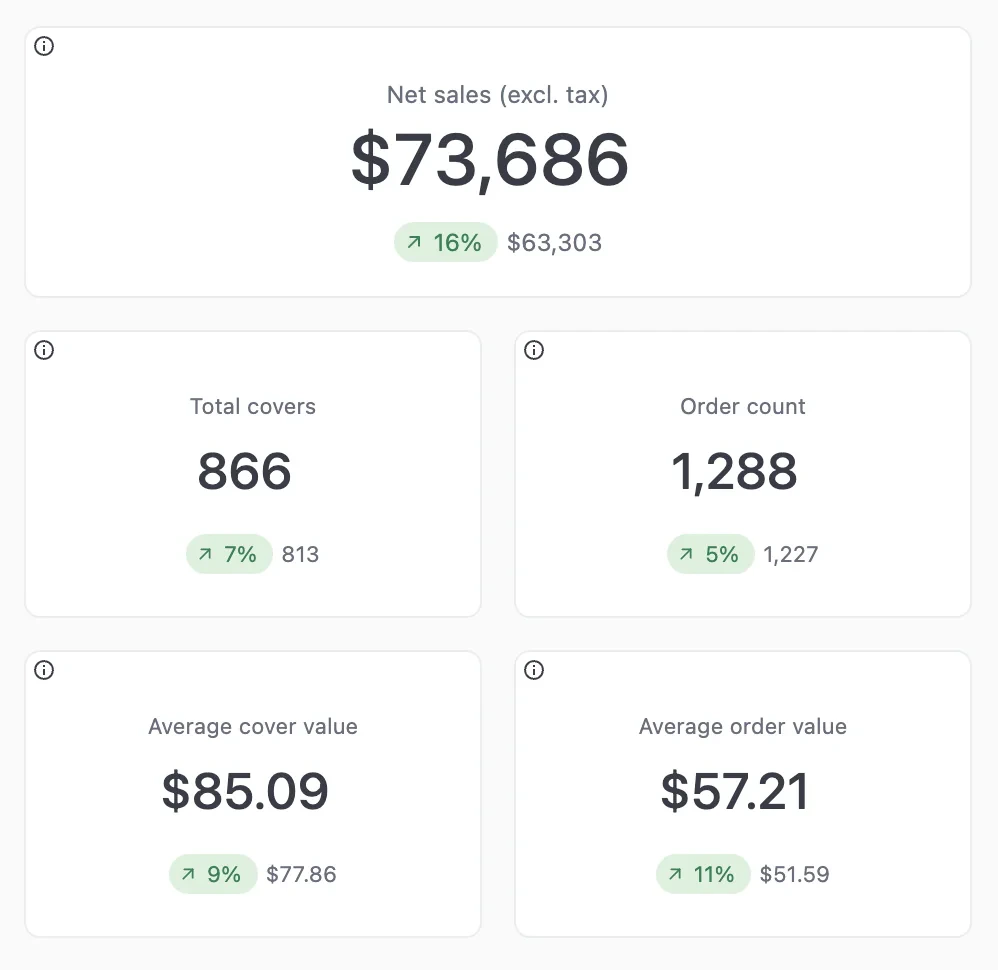
At-a-glance performance indicators: net sales, total covers, order count, average cover value, and average order value. Hover over the info icon next to each metric to see its definition.
* **Serving date/time** — When orders were fulfilled. Defaults to the past 7 days.
* **Outlet(s)** — Filter by one or multiple outlets. Supports wildcard search (e.g., "contains atlas").
* **Source** — Where orders came from (POS, scan to order, kiosk, etc.)
* **Fulfilment type** — Dine-in, pickup, or delivery
* **Serving hour of day** — Filter by specific hours
* **Serving day of week** — Filter by specific days
* **Brand** — Filter by brand if you operate multiple brands
* **Order created date/time** — When the order was created (different from serving time)
## Sections
### Key metrics
At-a-glance performance indicators: net sales, total covers, order count, average cover value, and average order value. Hover over the info icon next to each metric to see its definition.
 ### Sales summary
Financial breakdown from gross sales to final payments. Shows gross sales, discounts, net sales, tax, service charges, and expected payment.
### Sales summary
Financial breakdown from gross sales to final payments. Shows gross sales, discounts, net sales, tax, service charges, and expected payment.
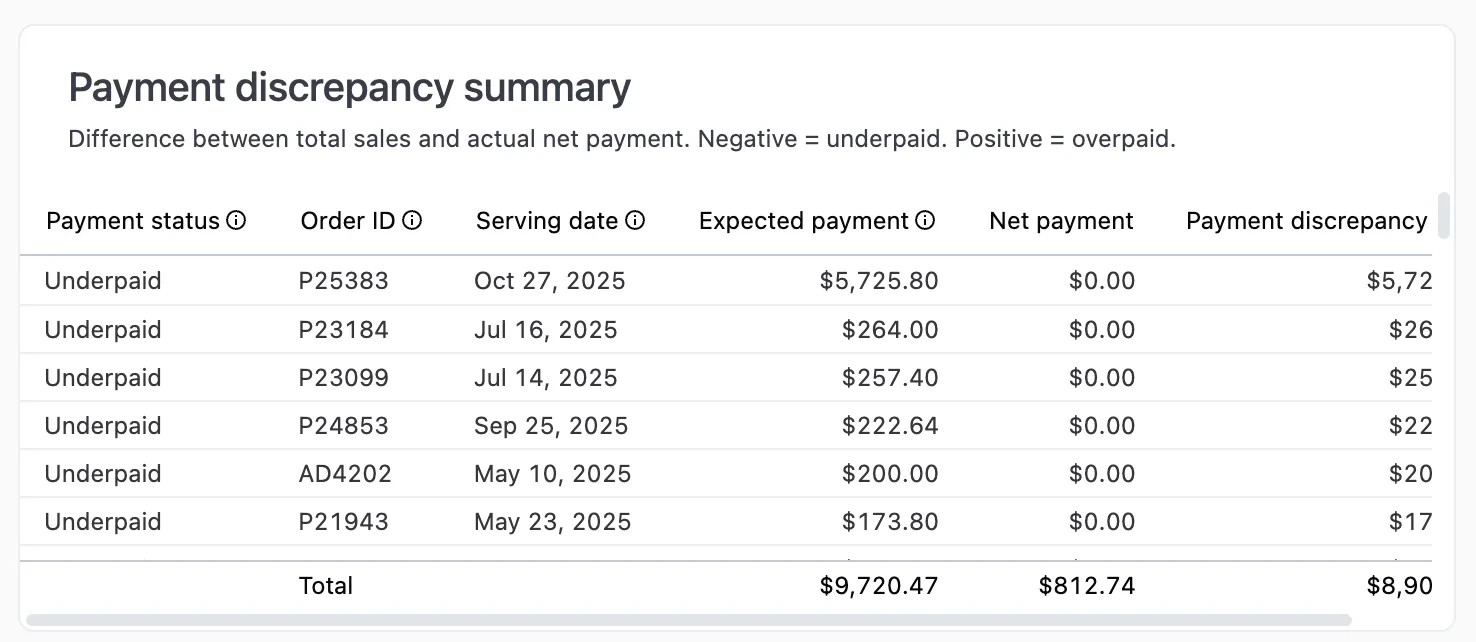
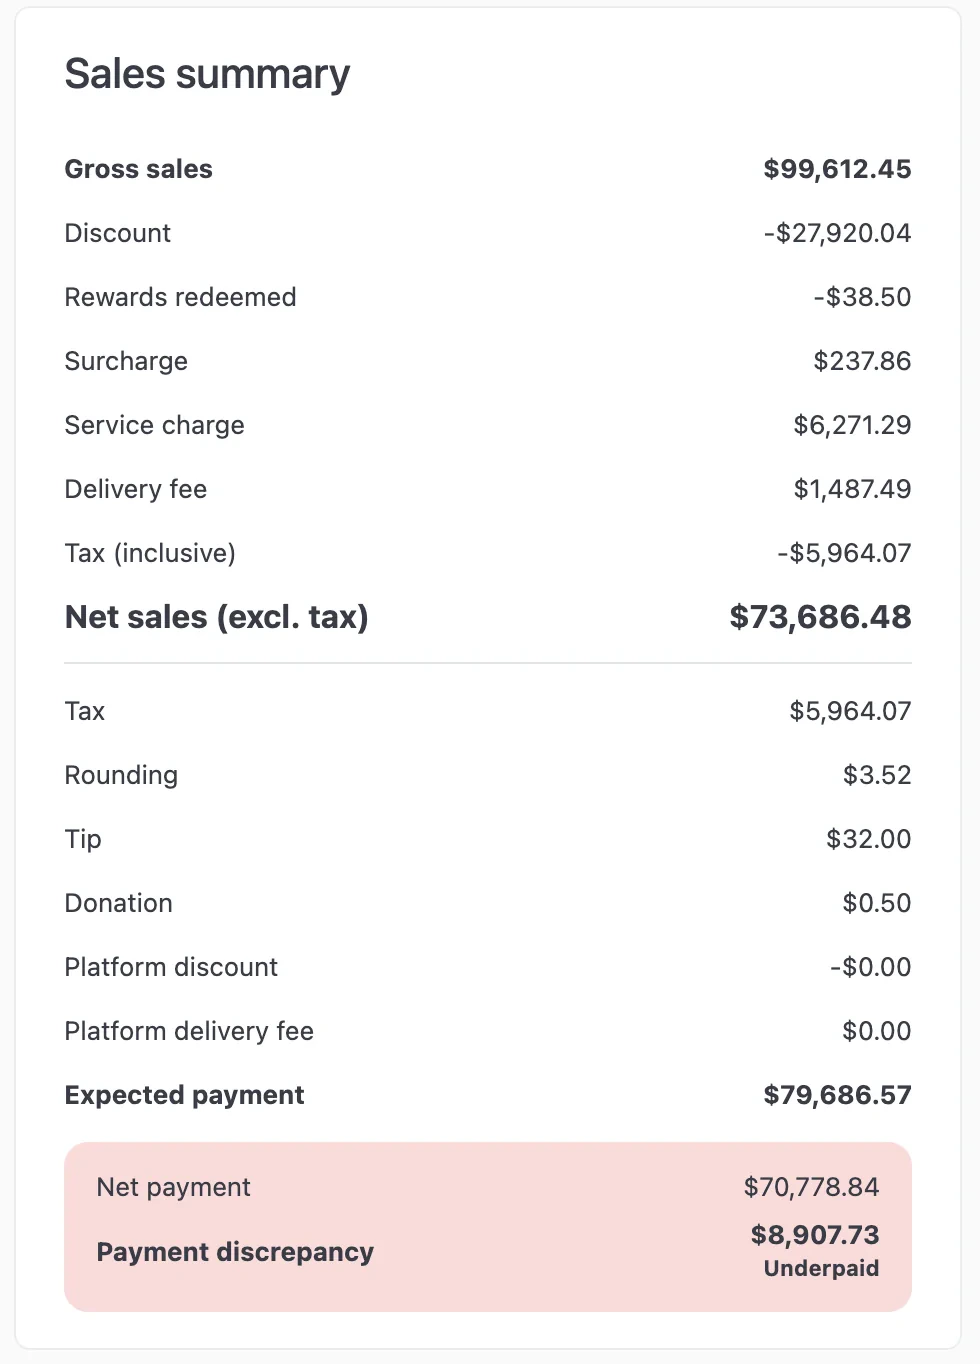 Also tracks **payment discrepancies** — the difference between expected and actual payment. Click on any order ID to investigate underpaid or overpaid orders.
 ### AI-generated insights
Automatically identifies trends, patterns, and notable changes in your sales data.
### Net sales charts
Three charts showing net sales broken down by:
* **Day** — Daily sales by fulfilment type
* **Day of week** — Which days perform best
* **Hour of day** — Peak and off-peak hours
Use the **Date granularity** dropdown on the "Net sales by day" chart to switch between daily, weekly, or monthly views.
### Payment type summary
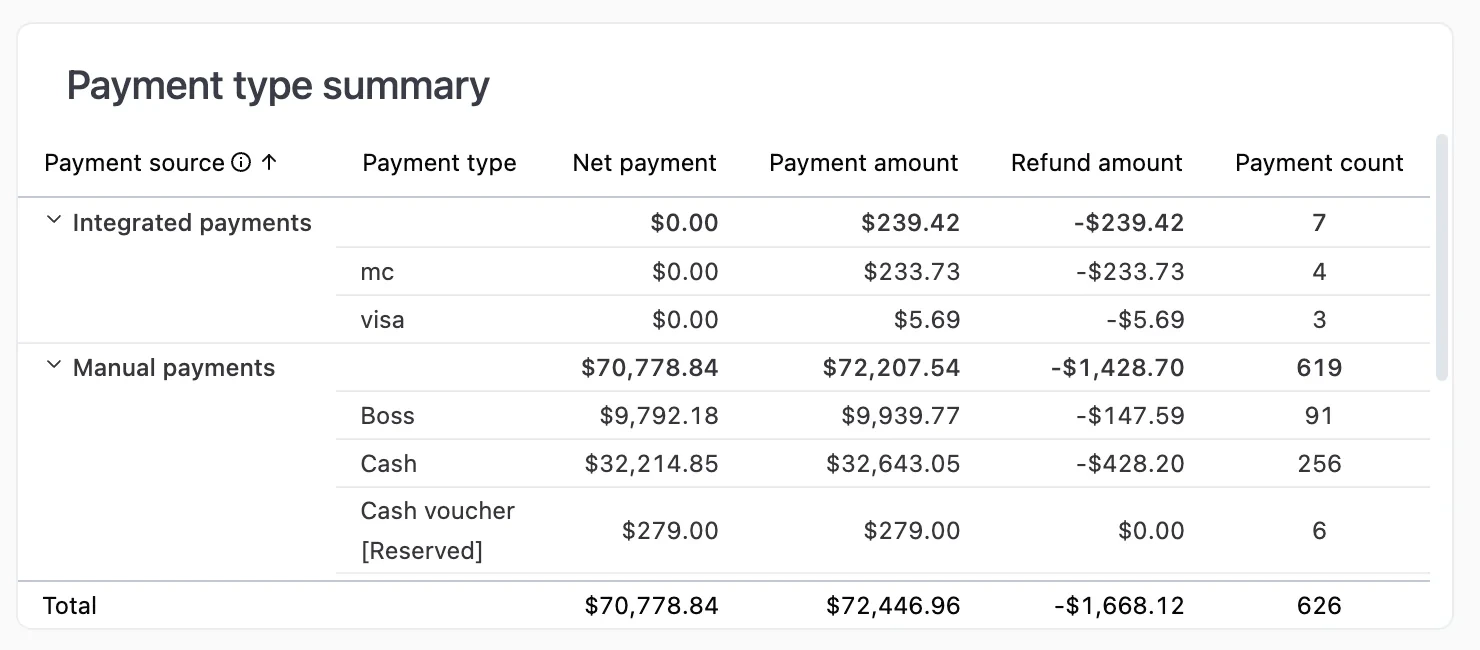
Breakdown of payment methods used, split into integrated payments (processed through Atlas) and manual payments.
### AI-generated insights
Automatically identifies trends, patterns, and notable changes in your sales data.
### Net sales charts
Three charts showing net sales broken down by:
* **Day** — Daily sales by fulfilment type
* **Day of week** — Which days perform best
* **Hour of day** — Peak and off-peak hours
Use the **Date granularity** dropdown on the "Net sales by day" chart to switch between daily, weekly, or monthly views.
### Payment type summary
Breakdown of payment methods used, split into integrated payments (processed through Atlas) and manual payments.
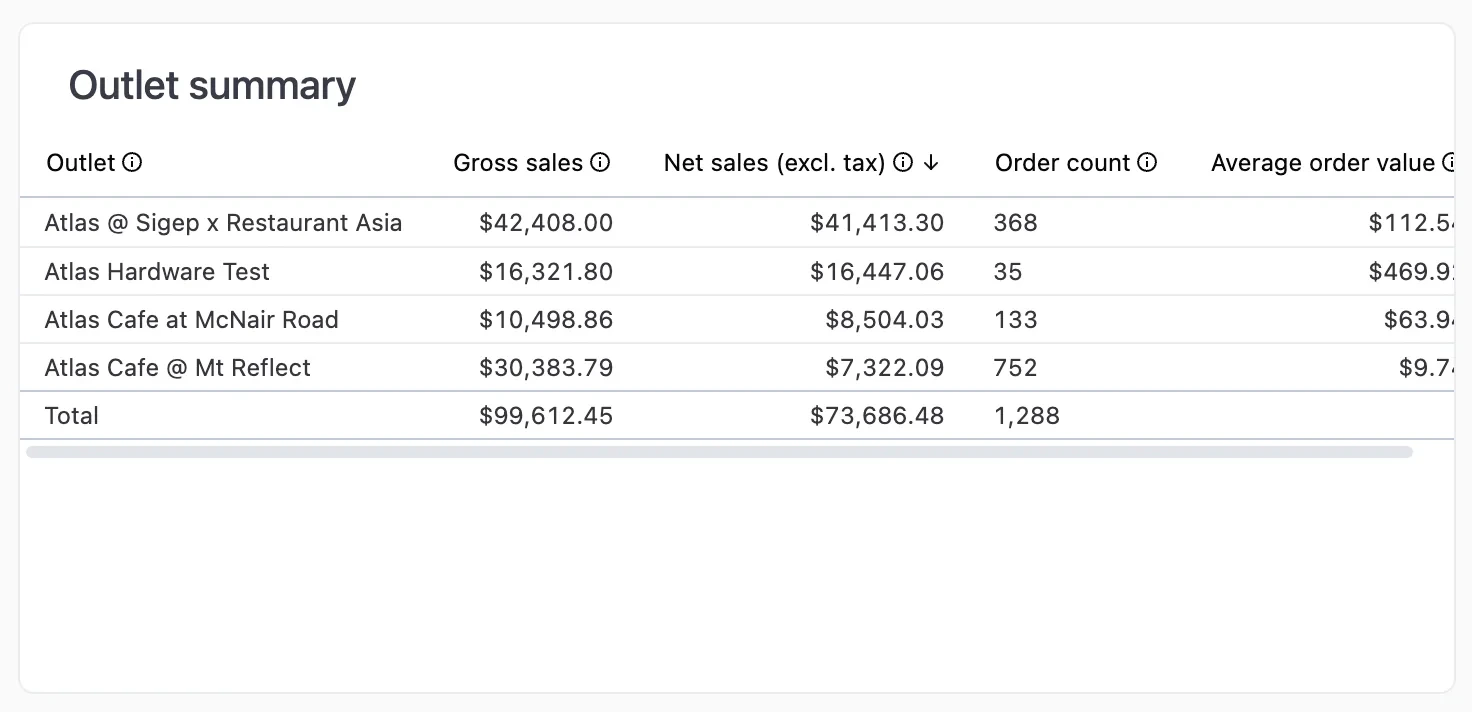
 ### Outlet summary
Compare sales performance across your outlets: gross sales, net sales, order count, and average order value per location.
### Outlet summary
Compare sales performance across your outlets: gross sales, net sales, order count, and average order value per location.
 ### Brand summary
Sales performance by brand. Useful for multi-brand operators.
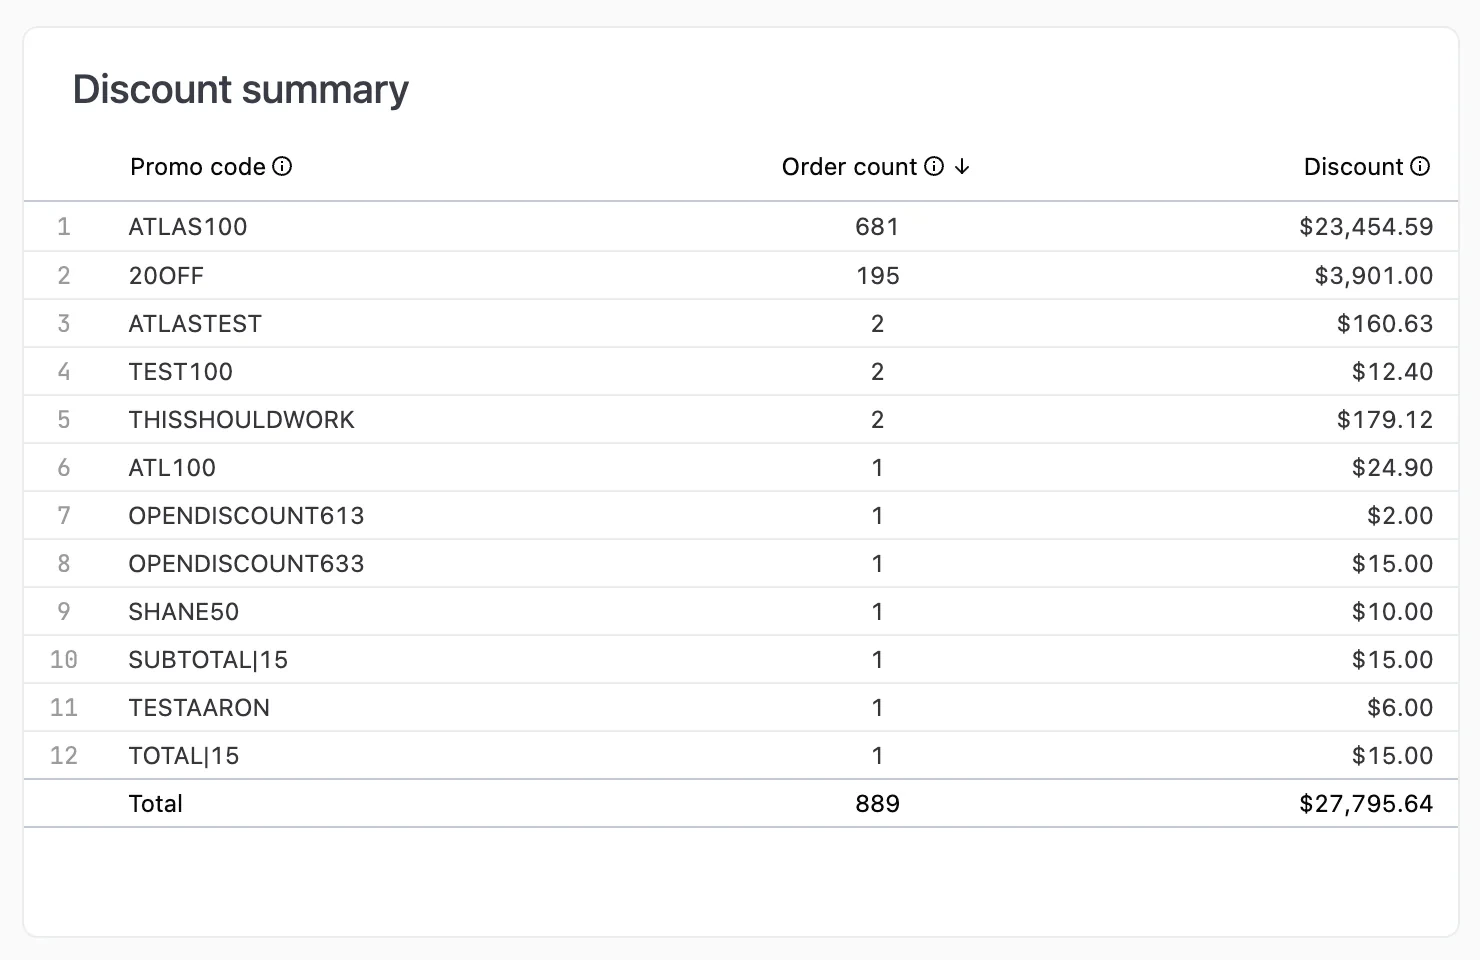
### Discount summary
Track promo code usage and total discount amounts.
### Brand summary
Sales performance by brand. Useful for multi-brand operators.
### Discount summary
Track promo code usage and total discount amounts.
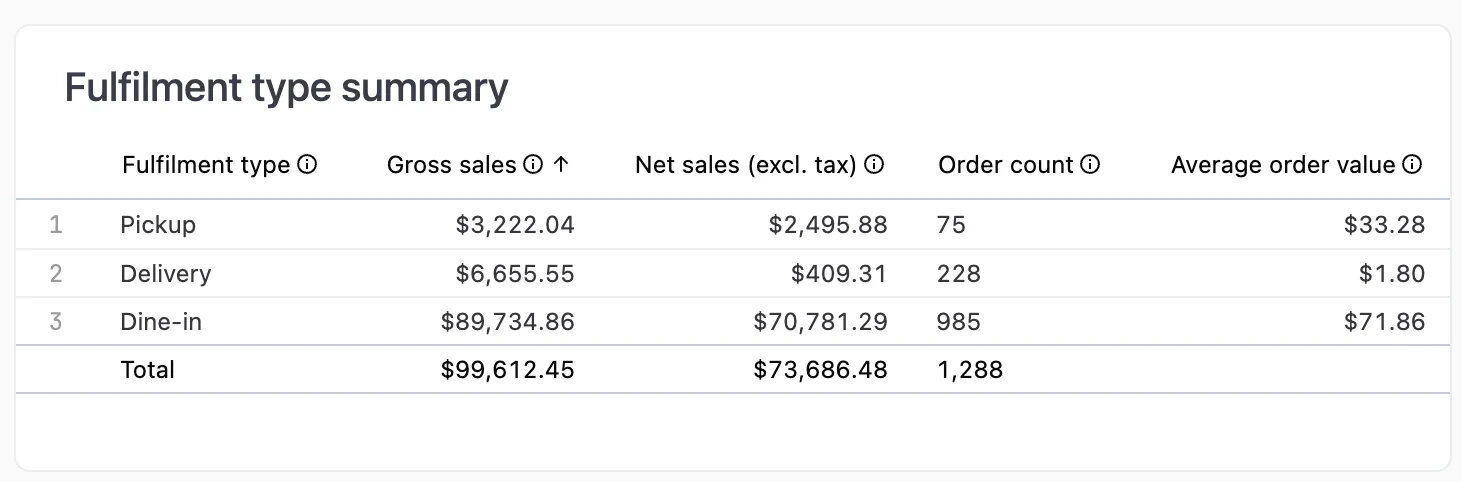
 ### Fulfilment type summary
Sales breakdown by how orders were fulfilled (dine-in, pickup, delivery).
### Fulfilment type summary
Sales breakdown by how orders were fulfilled (dine-in, pickup, delivery).
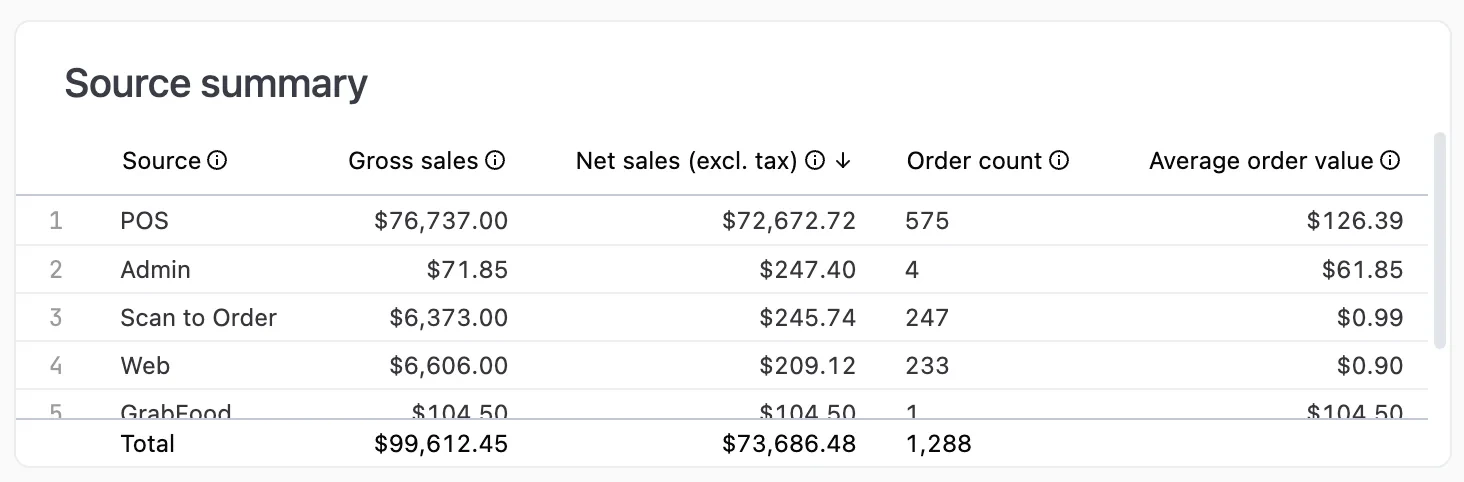
 ### Source summary
Sales breakdown by order source (POS, scan to order, web, delivery platforms, etc.)
### Source summary
Sales breakdown by order source (POS, scan to order, web, delivery platforms, etc.)
 ### Customer type summary
Sales breakdown by customer type (Member, Guest, or unknown).
### Loyalty redemption summary
Compare orders with and without loyalty reward redemptions. Click any row to drill into individual redemption details.
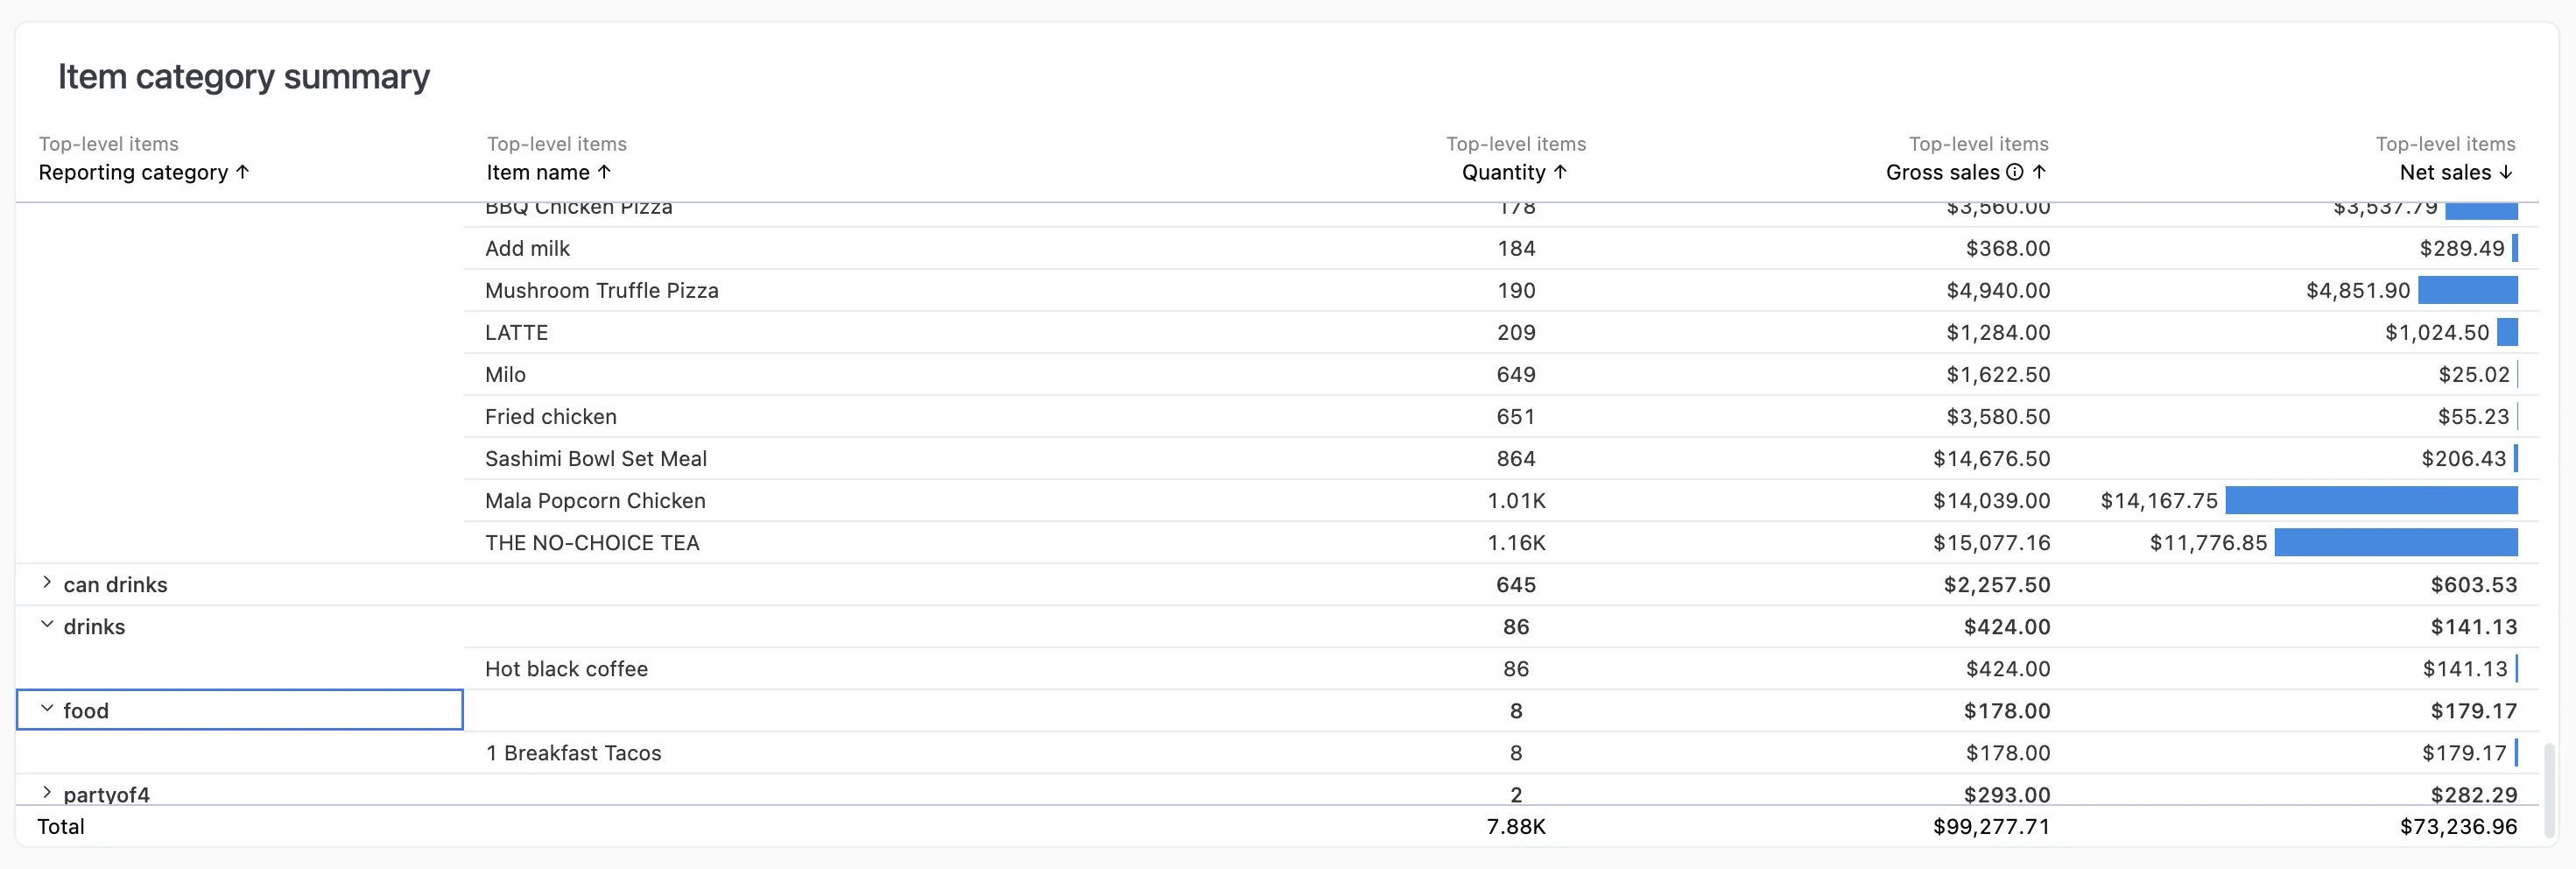
### Item category summary
Product sales organised by reporting category. Click on any item to see modifier breakdowns.
### Customer type summary
Sales breakdown by customer type (Member, Guest, or unknown).
### Loyalty redemption summary
Compare orders with and without loyalty reward redemptions. Click any row to drill into individual redemption details.
### Item category summary
Product sales organised by reporting category. Click on any item to see modifier breakdowns.
 To set up reporting categories, edit your product on the [Products page](https://portal.atlas.kitchen/products) and set its **Reporting category**.