> ## Documentation Index
> Fetch the complete documentation index at: https://help.atlas.kitchen/llms.txt
> Use this file to discover all available pages before exploring further.
# Product mix report
> Analyse product sales, quantities, and performance by category.
**Available for:** Manager Finance Admin
[Go to report →](https://portal.atlas.kitchen/analytics/product-mix)
## What this report shows
Product sales performance across your menu. See which items drive revenue vs volume, compare categories, and drill into modifier-level details.
The report is organized into three tabs:
* **Product mix** — Overview with AI insights, charts, and category breakdowns.
* **Product details** — Detailed product-level data.
* **Modifier groups** — Modifier group choices and performance across your menu.
Data refreshes hourly. Last refresh time appears at the top.
## Filters
 * **Serving date** — Date range. Defaults to past 30 days.
* **Outlet** — Filter by outlet.
* **Item name** — Search for specific products.
* **Item SKU** — Filter by SKU.
* **Item reporting category** — Filter by category.
* **Source** — Order source (POS, Kiosk, Web, etc.).
* **Fulfilment type** — Dine-in, Pickup, Delivery.
* **Serving hour of day** — Filter by hour.
* **Serving day of week** — Filter by day.
* **Table** — Filter by table.
## Sections
### AI insights
* **Serving date** — Date range. Defaults to past 30 days.
* **Outlet** — Filter by outlet.
* **Item name** — Search for specific products.
* **Item SKU** — Filter by SKU.
* **Item reporting category** — Filter by category.
* **Source** — Order source (POS, Kiosk, Web, etc.).
* **Fulfilment type** — Dine-in, Pickup, Delivery.
* **Serving hour of day** — Filter by hour.
* **Serving day of week** — Filter by day.
* **Table** — Filter by table.
## Sections
### AI insights
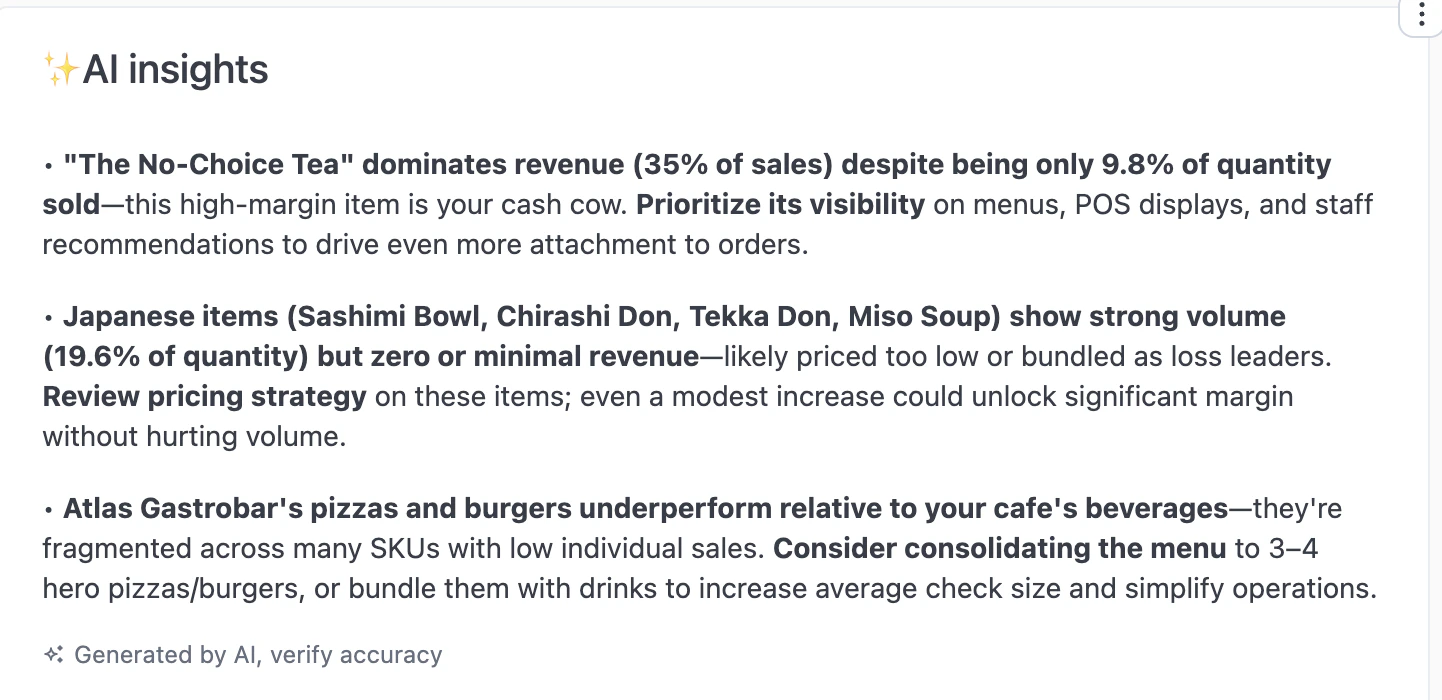 AI-generated analysis of your product mix. Identifies high-margin items, pricing opportunities, and menu consolidation suggestions.
### Item quantity vs sales
AI-generated analysis of your product mix. Identifies high-margin items, pricing opportunities, and menu consolidation suggestions.
### Item quantity vs sales
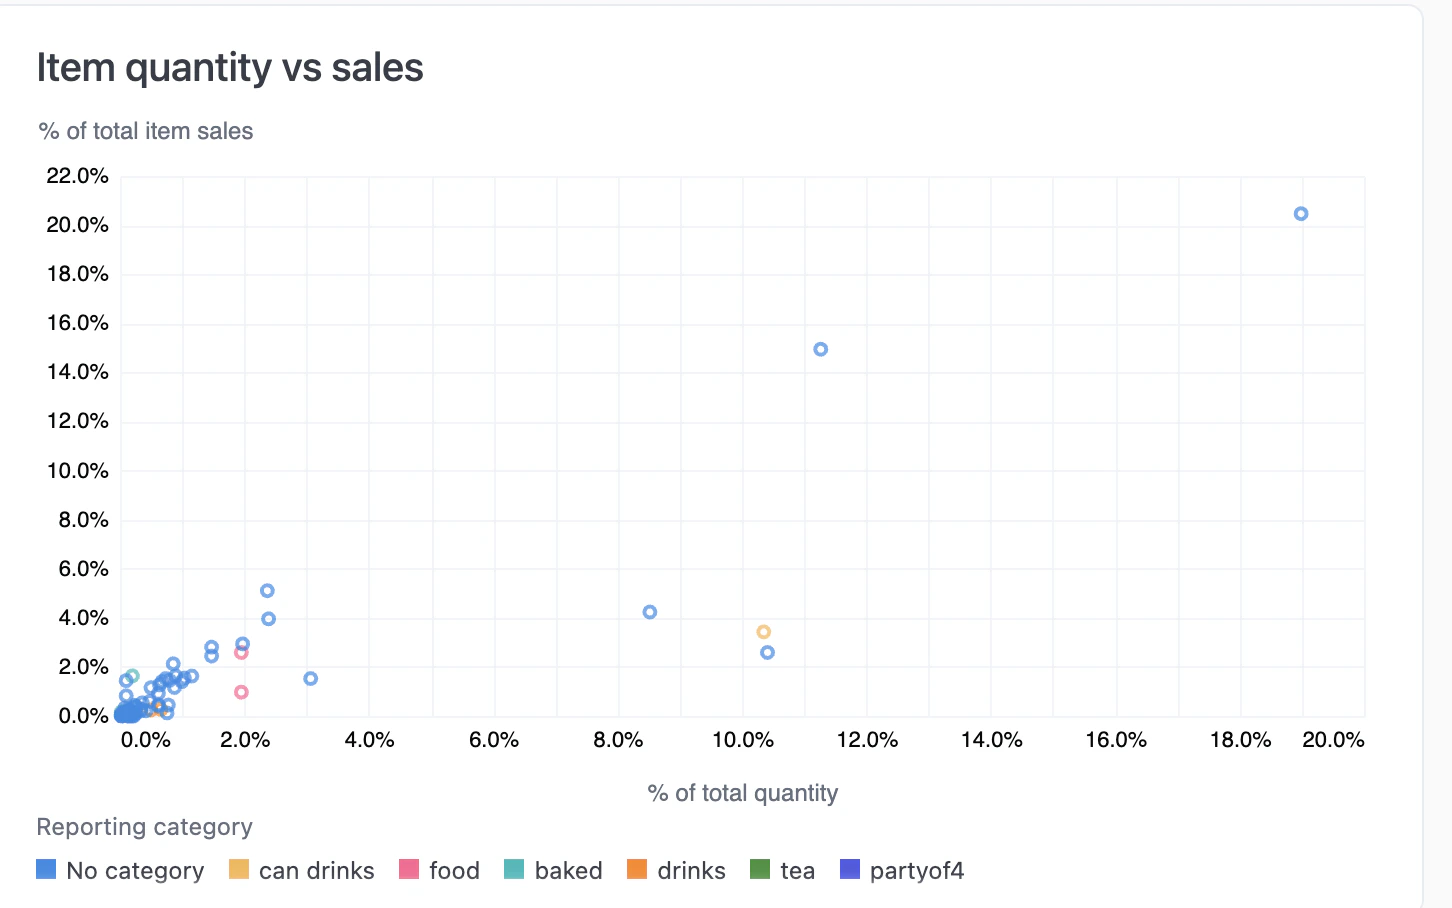 Scatter chart plotting each product by volume (quantity %) vs revenue (sales %). Products in the top-right are your stars—high volume and high revenue. Products with high quantity but low sales may be priced too low.
### Product mix by reporting category
Scatter chart plotting each product by volume (quantity %) vs revenue (sales %). Products in the top-right are your stars—high volume and high revenue. Products with high quantity but low sales may be priced too low.
### Product mix by reporting category
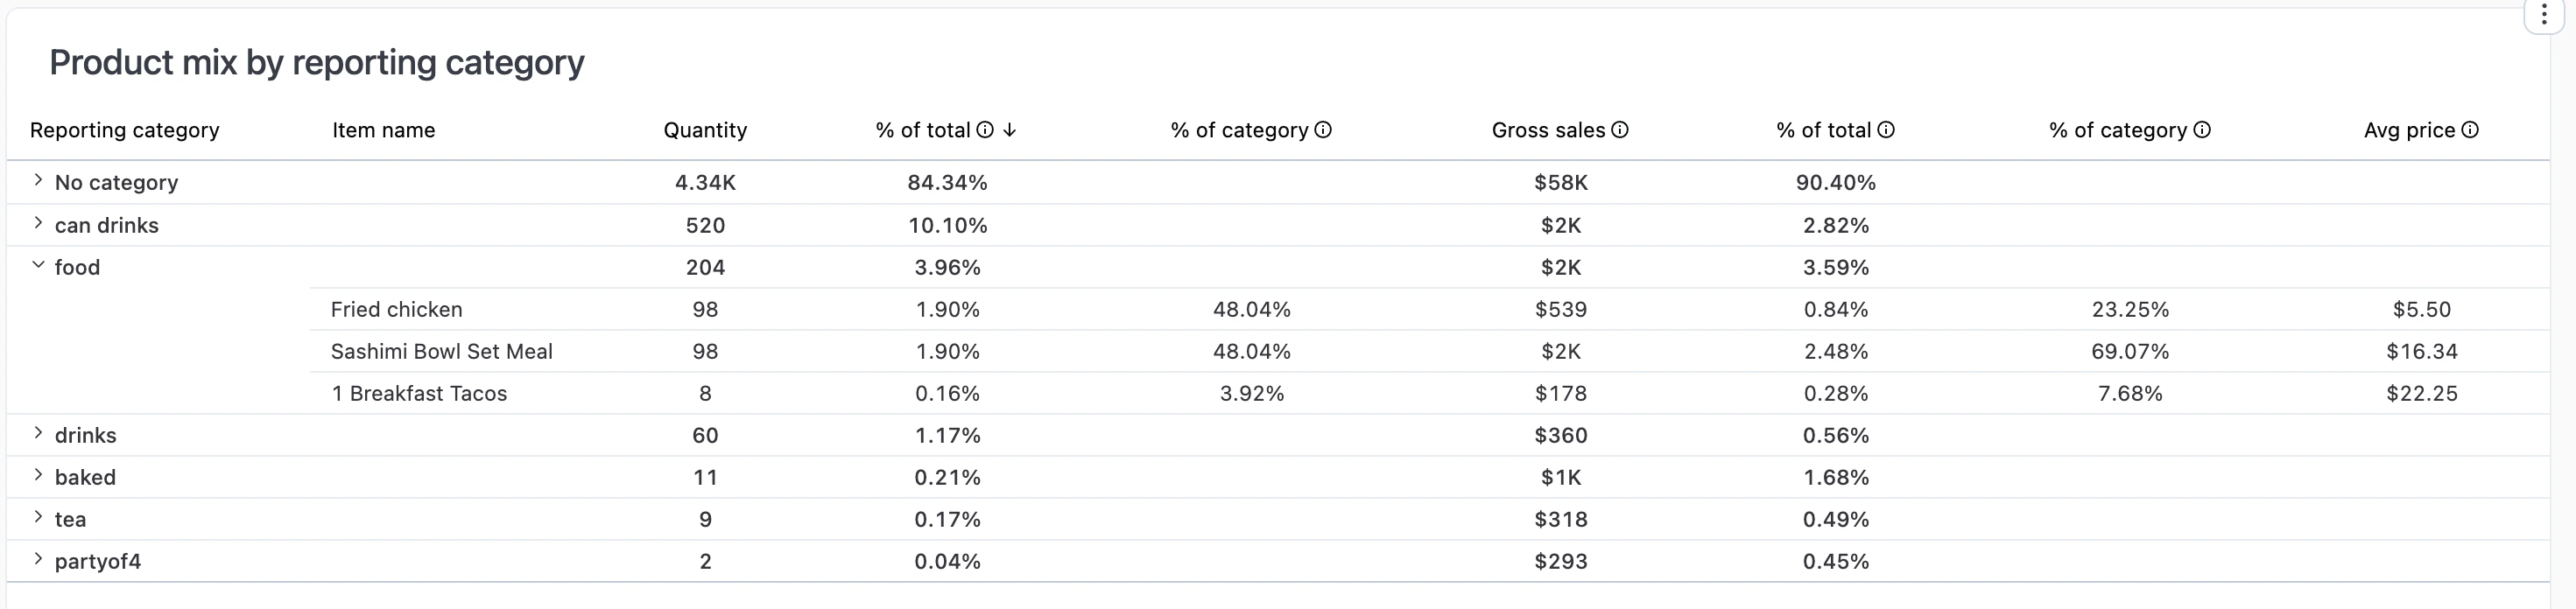 Expandable table grouped by reporting category. Click a category to see individual products within it.
**Columns:** Reporting category, item name, quantity, % of total, % of category, gross sales, % of total, % of category, average price.
### All products
Expandable table grouped by reporting category. Click a category to see individual products within it.
**Columns:** Reporting category, item name, quantity, % of total, % of category, gross sales, % of total, % of category, average price.
### All products
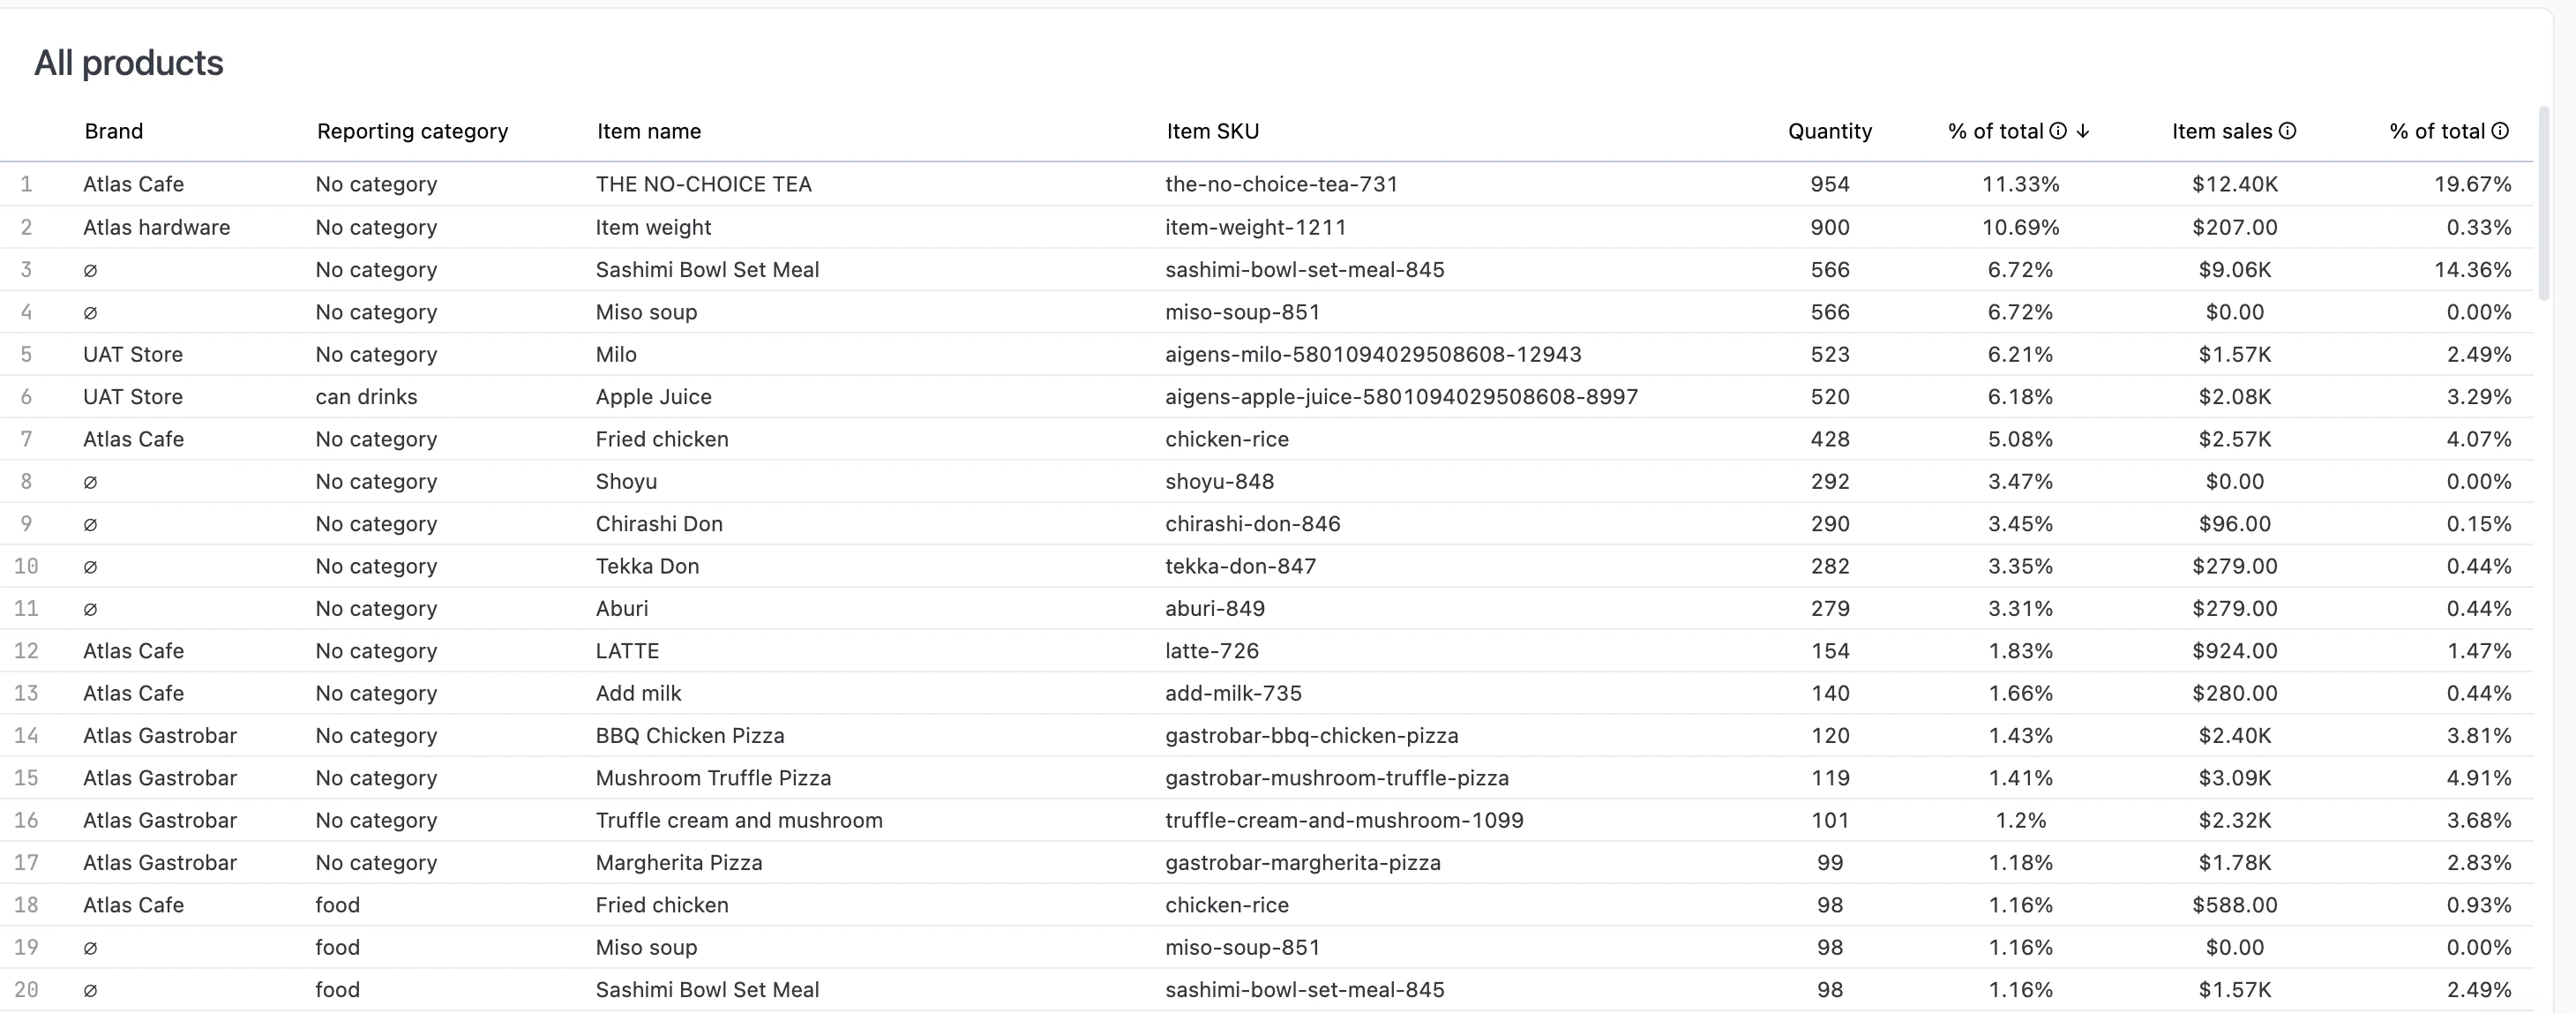 Flat list of every product. Useful for searching and sorting across your entire menu.
**Columns:** Brand, reporting category, item name, item SKU, quantity, % of total, item sales, % of total.
### Sales by team member
Gross sales broken down by team member and reporting category.
## Product name actions
Click an underlined product name to see available actions.
* **Single product view** — Open a detailed dashboard for that product (see below).
* **Modifier groups used in** — Jump to the Modifier groups tab, filtered to show which modifier groups include this product.
### Single product view
Flat list of every product. Useful for searching and sorting across your entire menu.
**Columns:** Brand, reporting category, item name, item SKU, quantity, % of total, item sales, % of total.
### Sales by team member
Gross sales broken down by team member and reporting category.
## Product name actions
Click an underlined product name to see available actions.
* **Single product view** — Open a detailed dashboard for that product (see below).
* **Modifier groups used in** — Jump to the Modifier groups tab, filtered to show which modifier groups include this product.
### Single product view
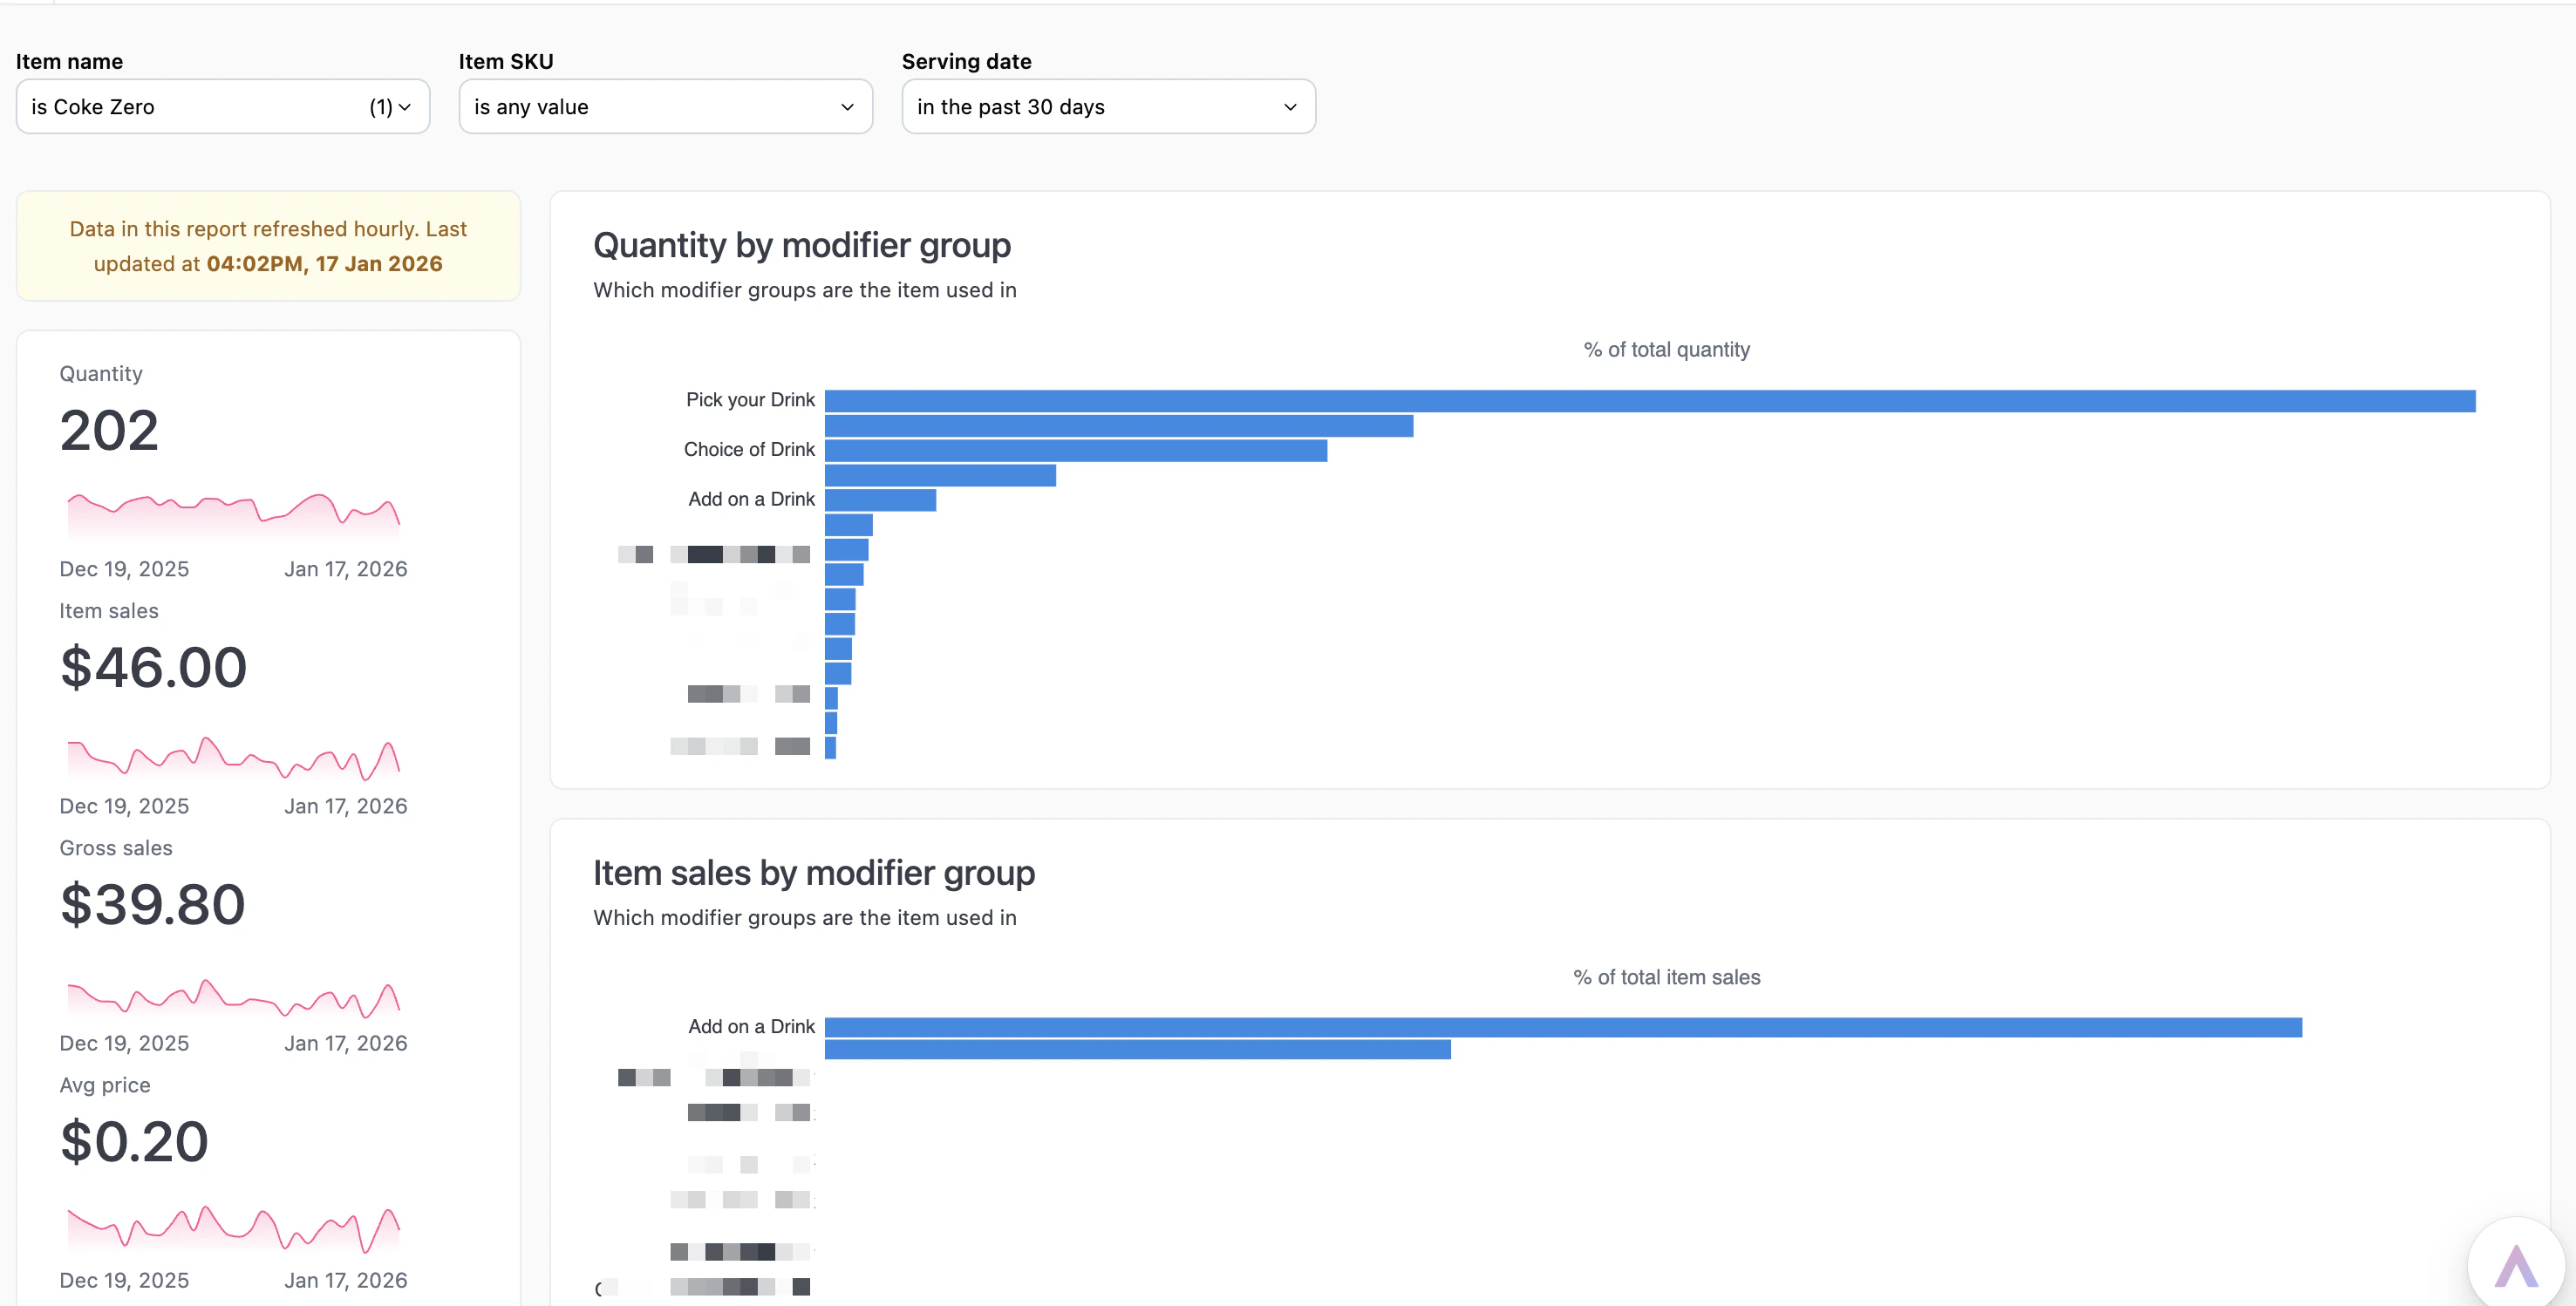 The single product view shows:
* **Metrics** — Quantity, item sales, gross sales, average price over time.
* **Quantity by modifier group** — Which modifier groups include this product.
* **Item sales by modifier group** — Revenue contribution by modifier group.
## Drilling into data
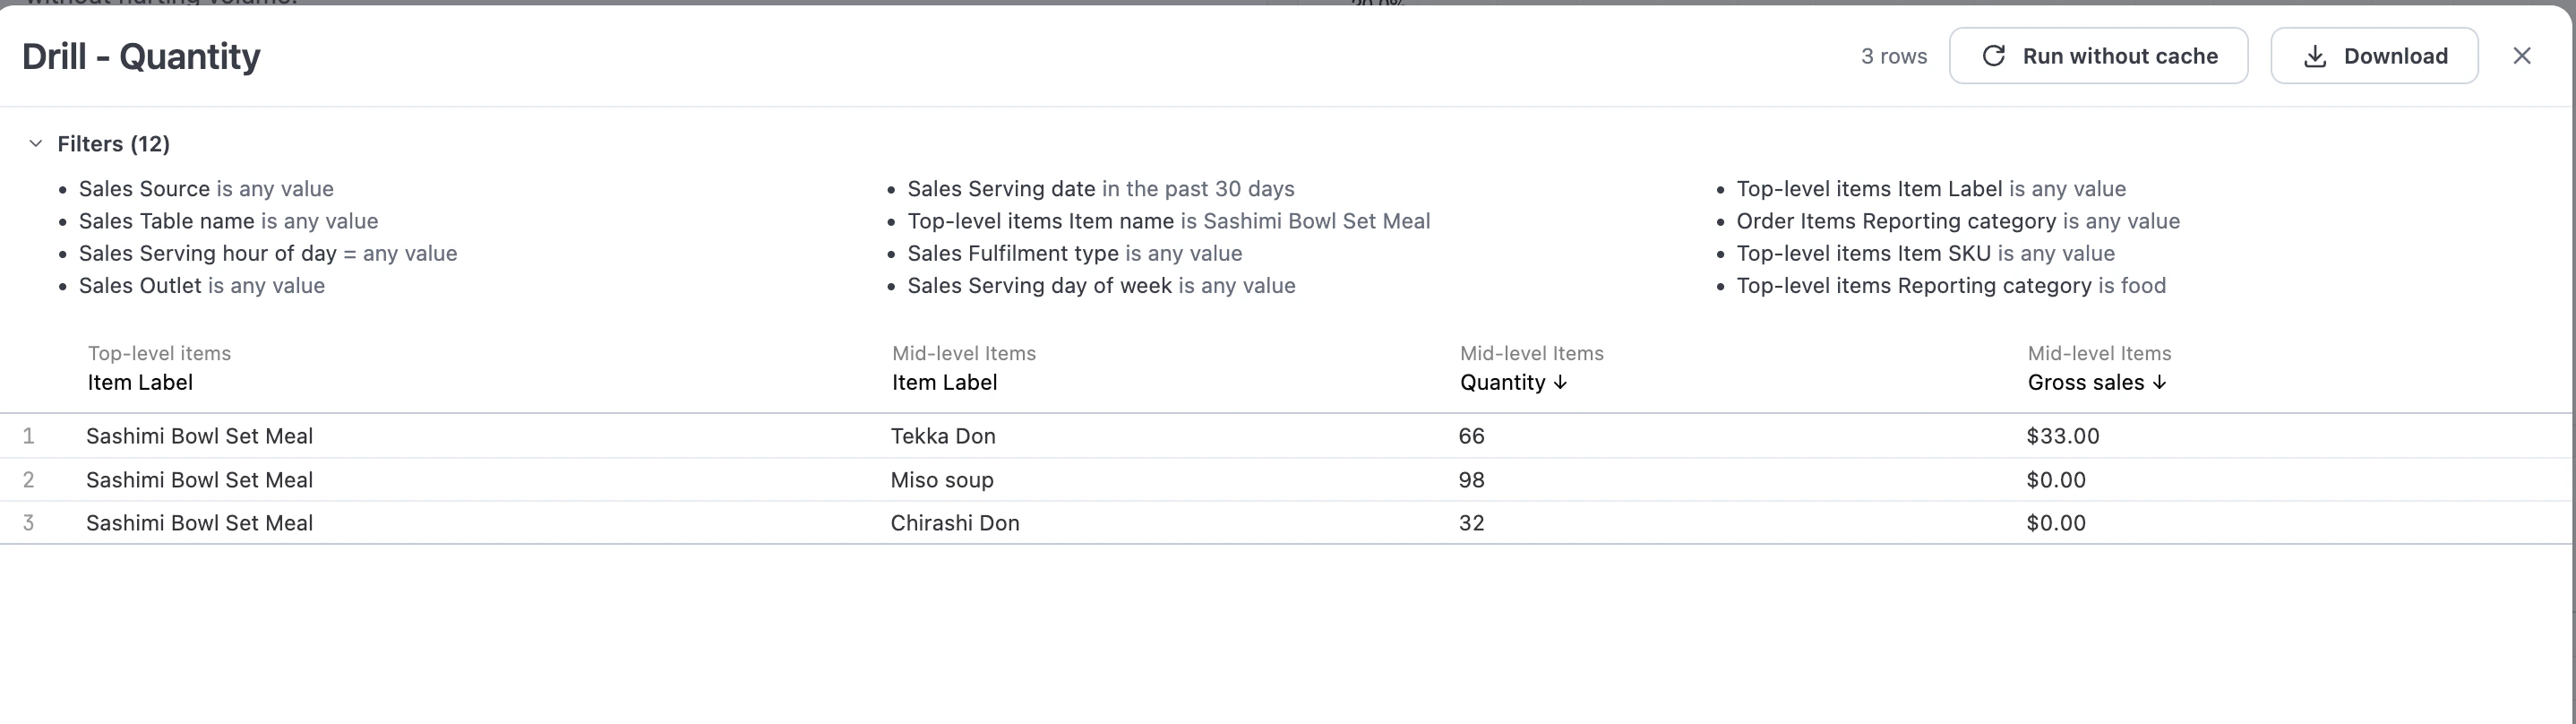
Click any metric value to drill into the underlying data.
The single product view shows:
* **Metrics** — Quantity, item sales, gross sales, average price over time.
* **Quantity by modifier group** — Which modifier groups include this product.
* **Item sales by modifier group** — Revenue contribution by modifier group.
## Drilling into data
Click any metric value to drill into the underlying data.
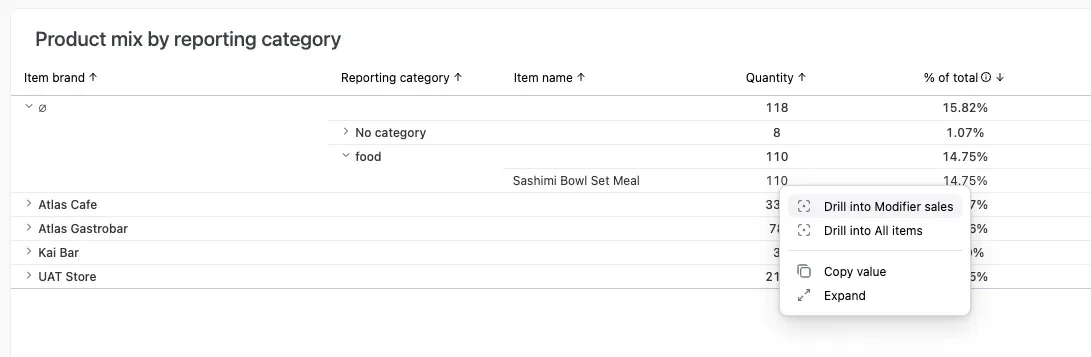 * **Drill into Modifier sales** — See how different modifiers performed for that product.
* **Drill into All items** — View every order item that contributed to that metric.
* **Drill into Modifier sales** — See how different modifiers performed for that product.
* **Drill into All items** — View every order item that contributed to that metric.
 ## Interactive features
* **Drill down** — Click any metric to see underlying data.
* **Download** — Export data from any chart or table.
* **Copy values** — Click any metric to copy to clipboard.
* **AI assistant** — Ask questions about your data. See [Using reports](/reports/using-reports#ai-assistant).
## Interactive features
* **Drill down** — Click any metric to see underlying data.
* **Download** — Export data from any chart or table.
* **Copy values** — Click any metric to copy to clipboard.
* **AI assistant** — Ask questions about your data. See [Using reports](/reports/using-reports#ai-assistant).