> ## Documentation Index
> Fetch the complete documentation index at: https://help.atlas.kitchen/llms.txt
> Use this file to discover all available pages before exploring further.
# Production efficiency report
> Track how long kitchen tickets take to complete.
**Available for:** Server Cashier Manager Finance Admin
[Go to report →](https://portal.atlas.kitchen/analytics/production-efficiency)
## What this report shows
How long it takes to complete kitchen tickets using data from your Kitchen Display System (KDS). Track ticket completion times, identify peak periods, and find bottlenecks.
This report requires Atlas Kitchen Display System (KDS). Data comes from ticket interactions on your kitchen screens.
Voided items are excluded from this report and do not contribute to preparation timings.
## Filters
 * **Serving date** — Serving date. Defaults to today.
* **Outlet** — Switch between outlets.
* **Station** — Filter by kitchen station (e.g., grill, fryer, prep).
* **Kitchen display** — View data from specific KDS screens.
* **Ticket item name** — Filter by specific menu items.
Data refreshes hourly. Last refresh time appears at the top.
## Sections
### Key metrics
* **Serving date** — Serving date. Defaults to today.
* **Outlet** — Switch between outlets.
* **Station** — Filter by kitchen station (e.g., grill, fryer, prep).
* **Kitchen display** — View data from specific KDS screens.
* **Ticket item name** — Filter by specific menu items.
Data refreshes hourly. Last refresh time appears at the top.
## Sections
### Key metrics
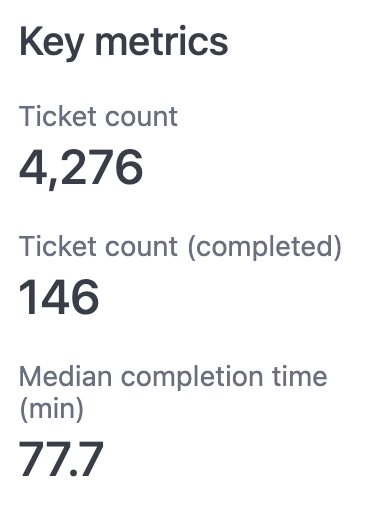 * **Ticket count** — Total tickets received.
* **Ticket count (completed)** — Tickets marked complete.
* **Median completion time** — Middle value of all completion times (in minutes).
### AI summary
* **Ticket count** — Total tickets received.
* **Ticket count (completed)** — Tickets marked complete.
* **Median completion time** — Middle value of all completion times (in minutes).
### AI summary
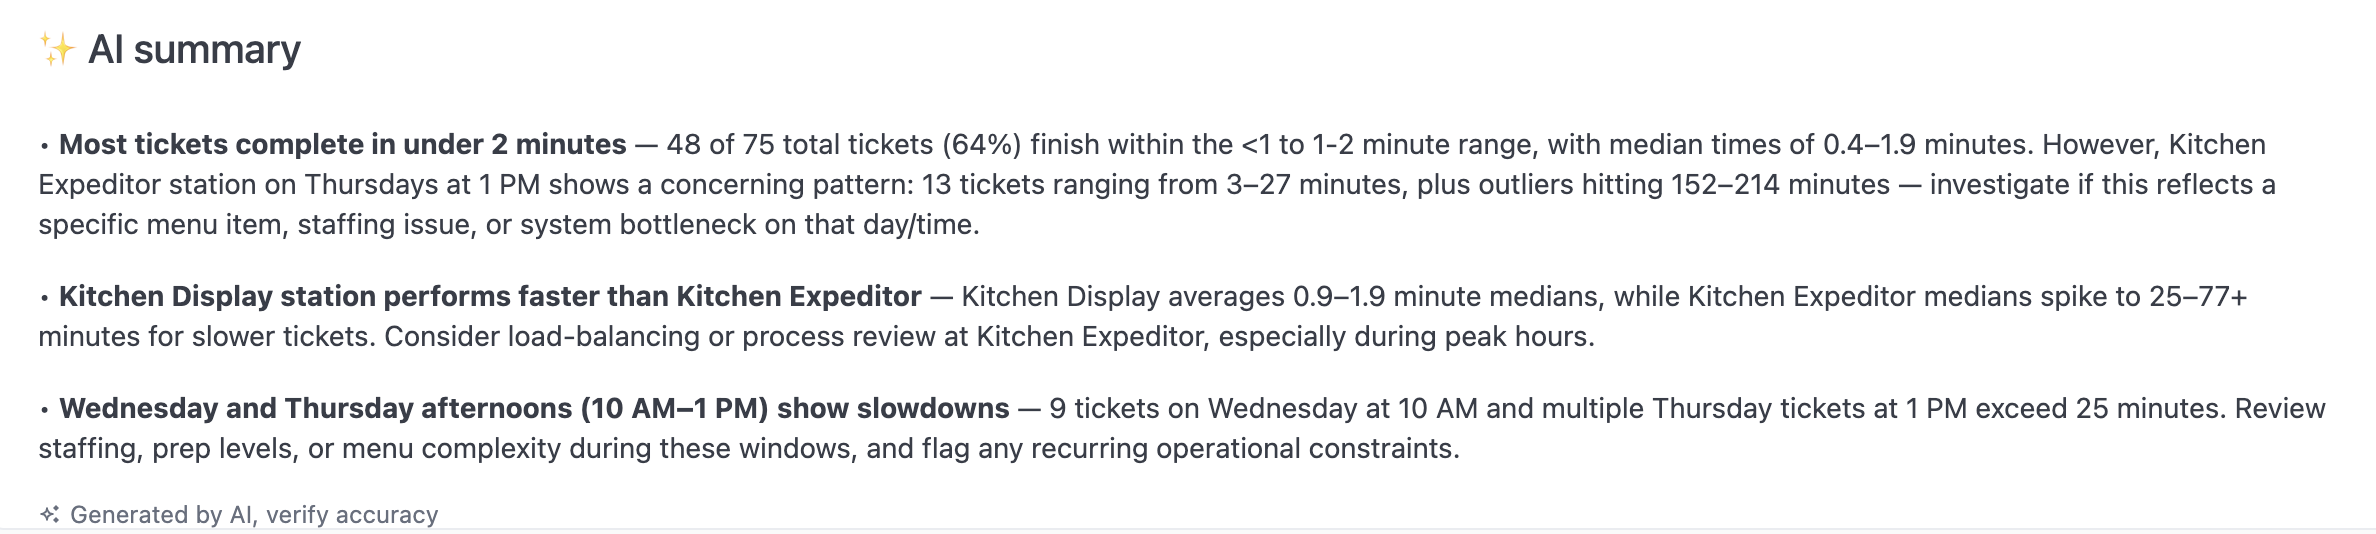 AI-generated summary of patterns and trends in your data.
### Tickets by fulfilment time
AI-generated summary of patterns and trends in your data.
### Tickets by fulfilment time
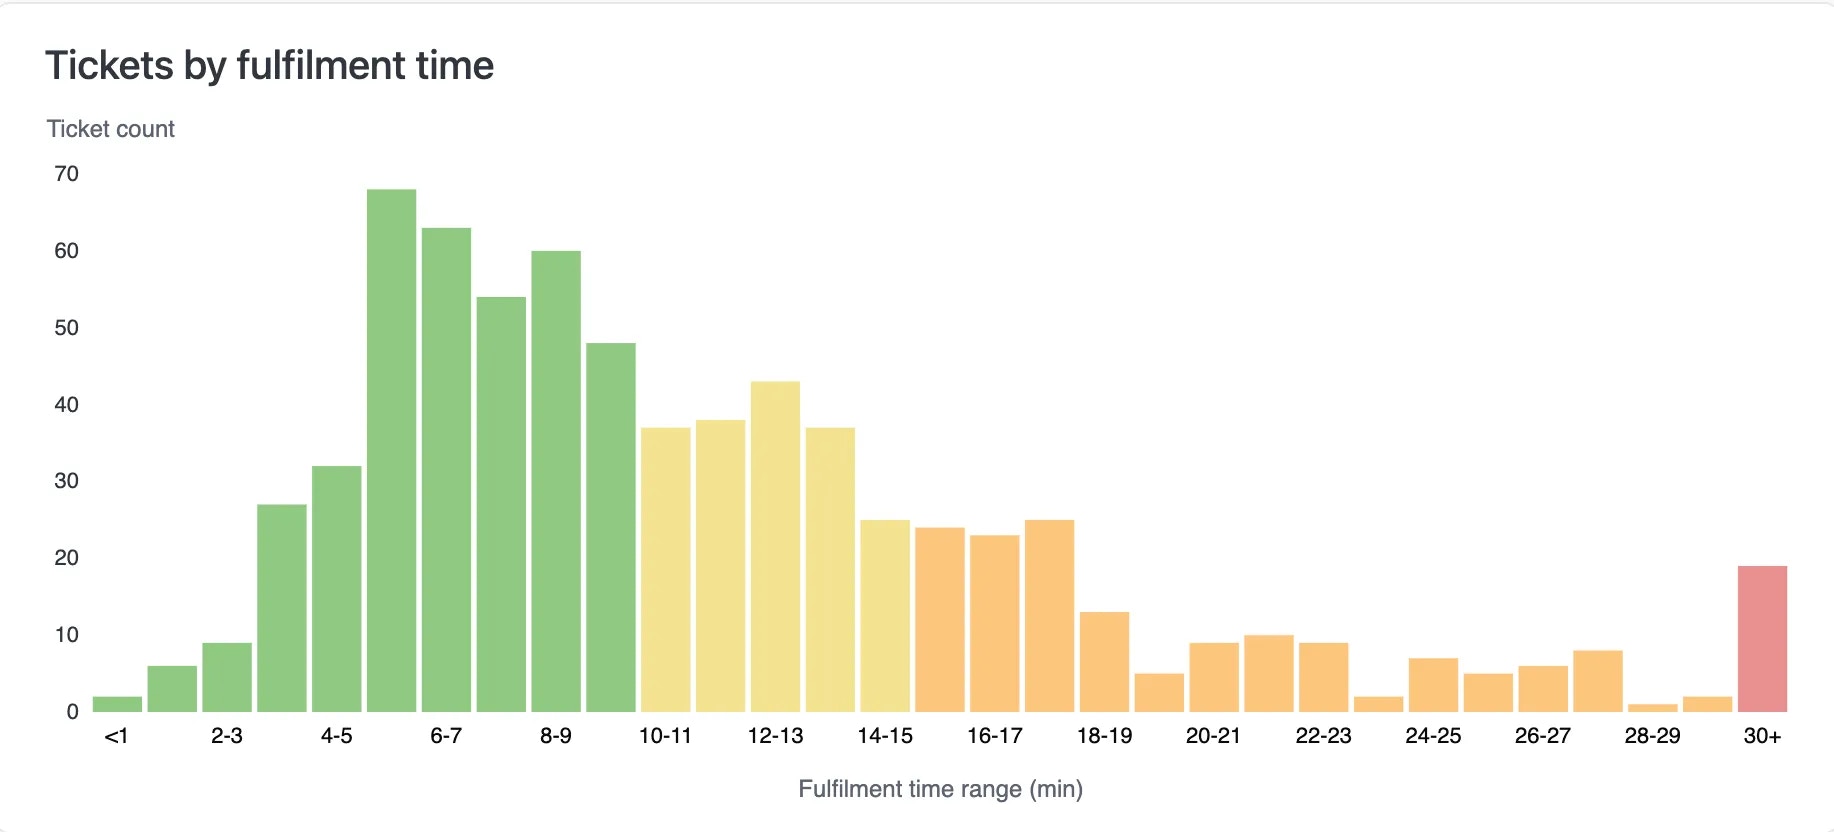 Tickets grouped by how long they took to complete. Shows your kitchen's speed distribution.
### Tickets by hour
Tickets grouped by how long they took to complete. Shows your kitchen's speed distribution.
### Tickets by hour
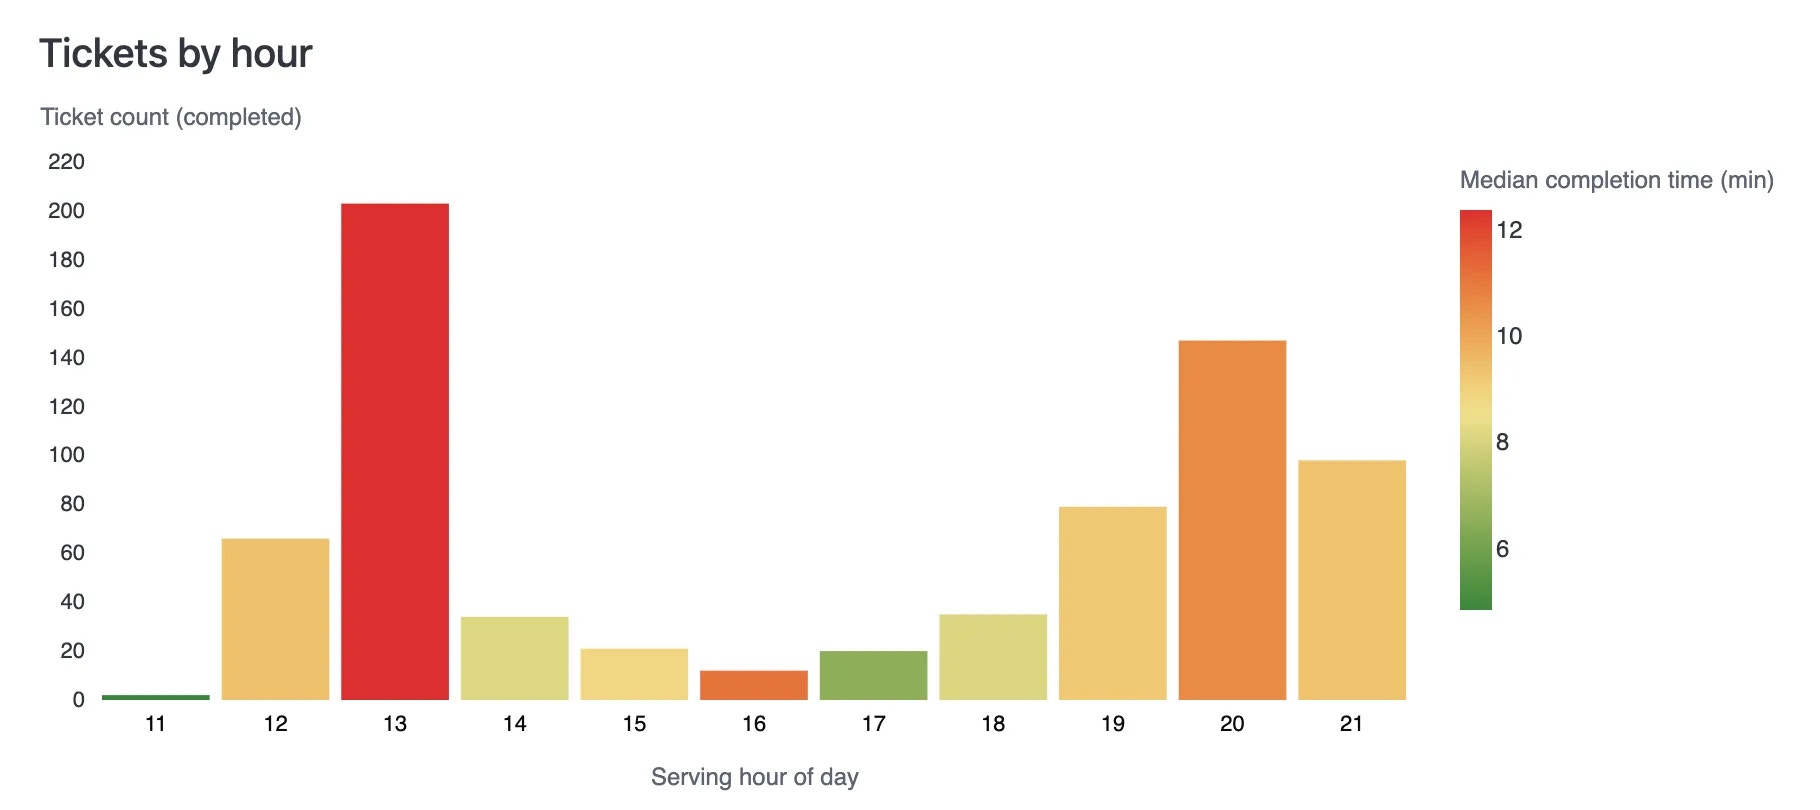 Ticket count per hour. Bar colour indicates median completion time:
* **Green** — Faster
* **Red** — Slower
Use this to spot periods when your kitchen struggles to keep up.
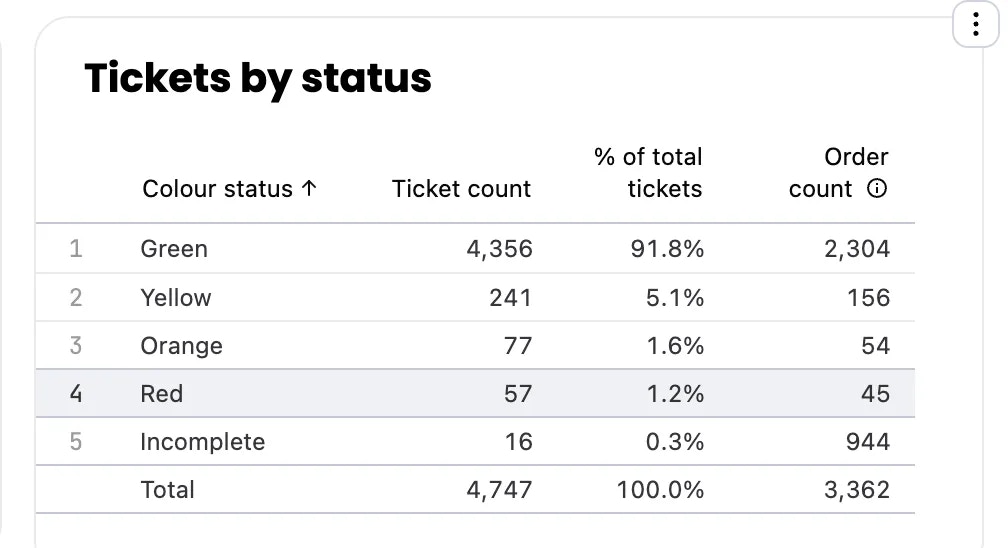
### Tickets by status
Tickets grouped by colour status, showing how many completed on time vs over target.
Ticket count per hour. Bar colour indicates median completion time:
* **Green** — Faster
* **Red** — Slower
Use this to spot periods when your kitchen struggles to keep up.
### Tickets by status
Tickets grouped by colour status, showing how many completed on time vs over target.
 ### Tickets by day of week and shift
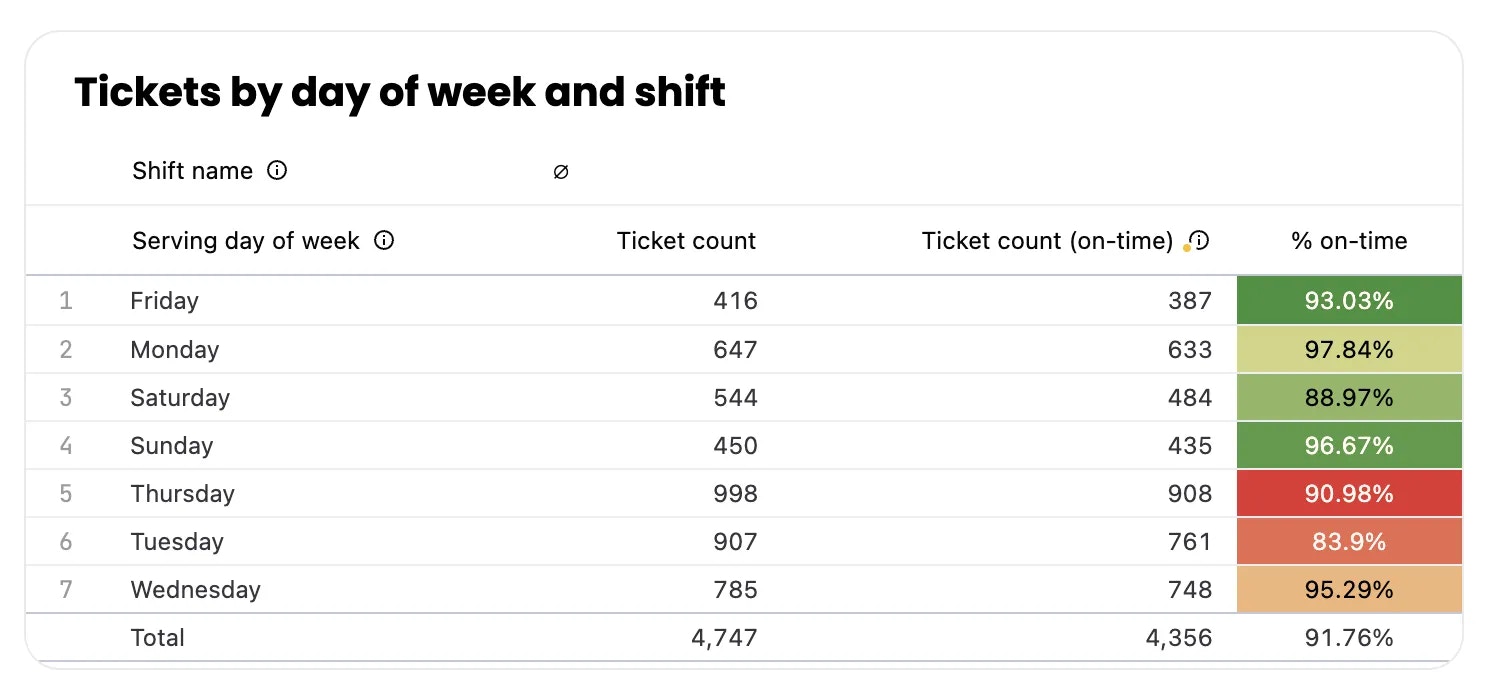
On-time performance broken down by day of week and shift.
### Tickets by day of week and shift
On-time performance broken down by day of week and shift.
 ### Ticket details
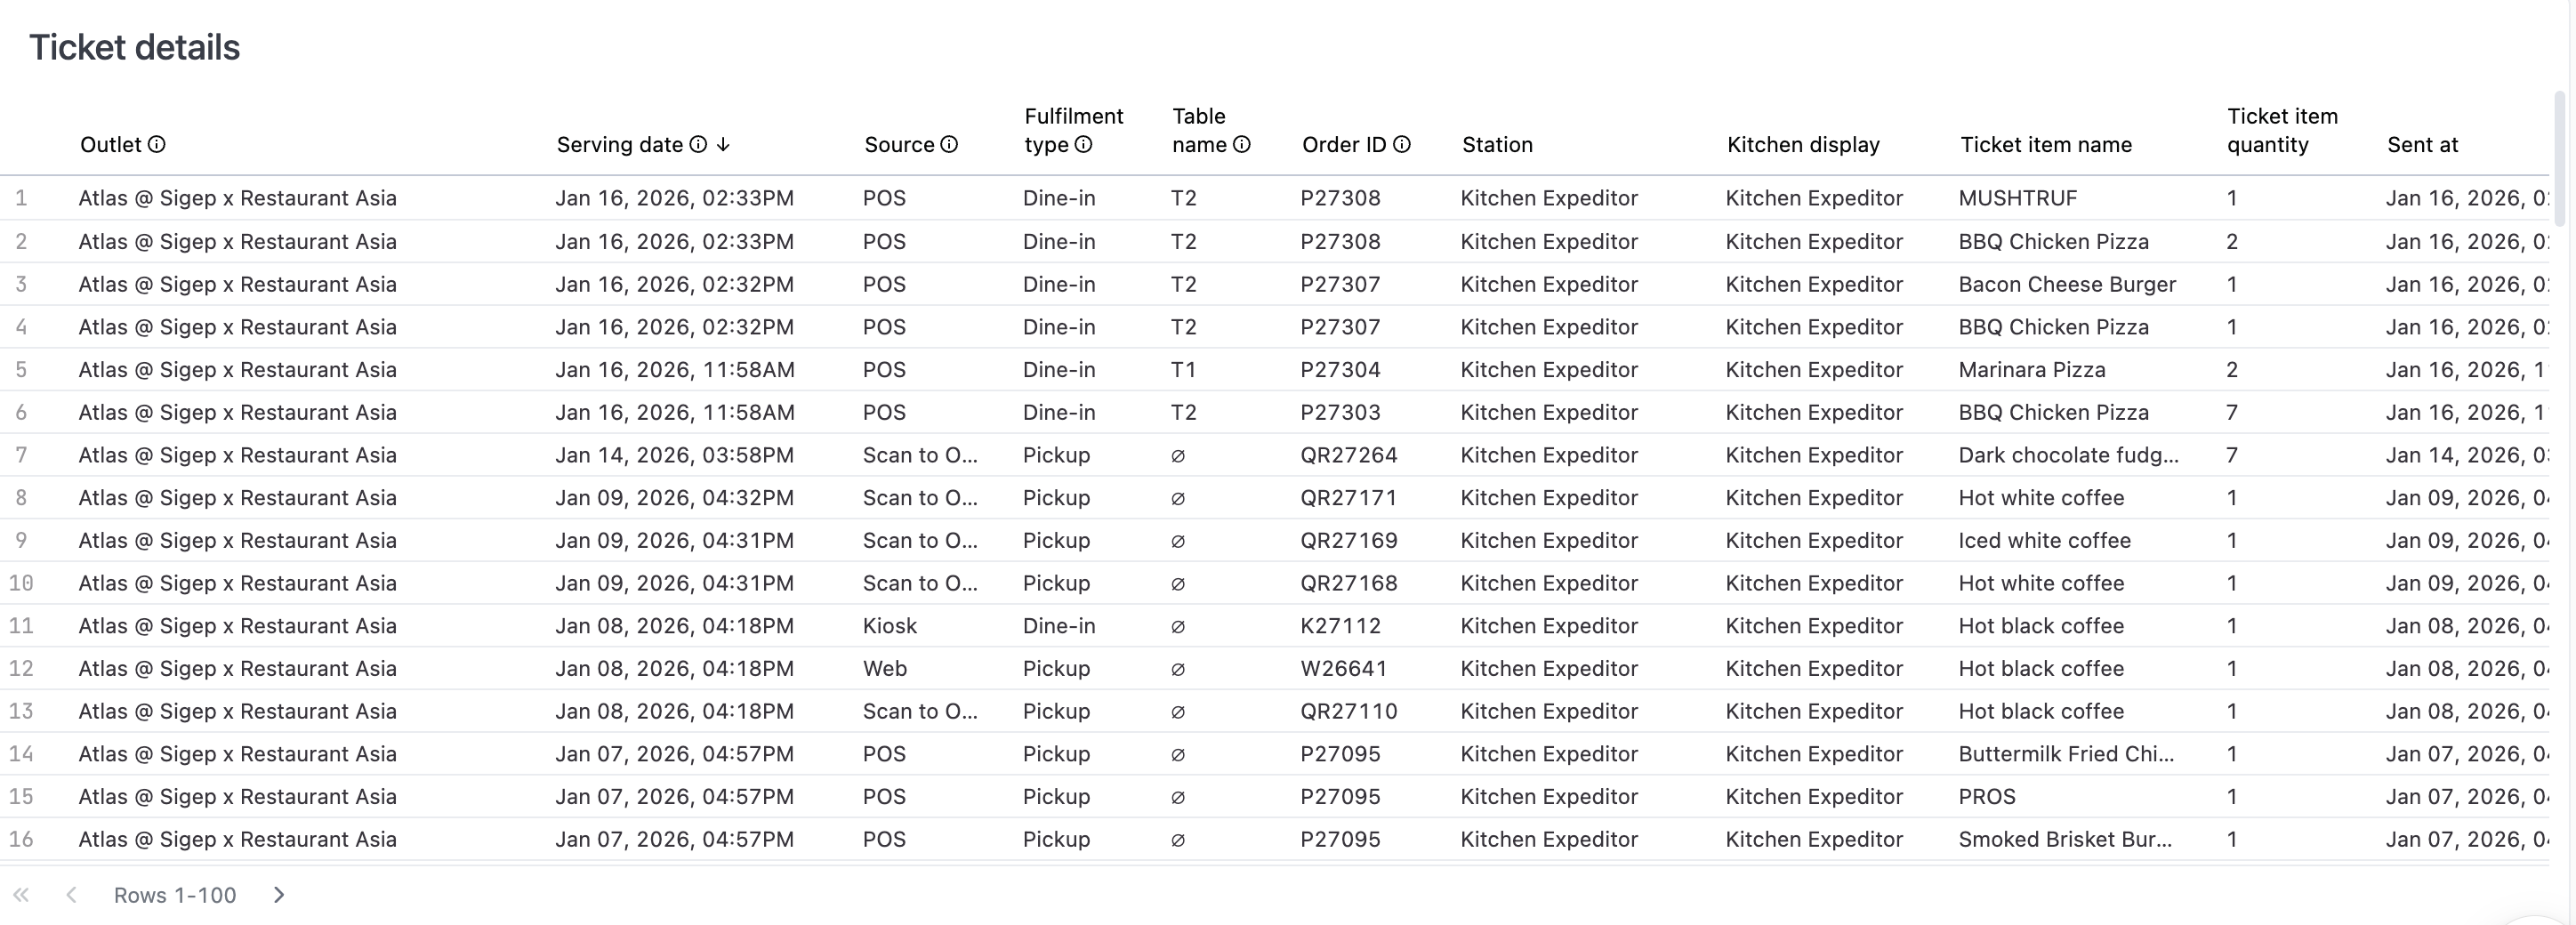 Complete list of every ticket. Download for detailed analysis.
## Interactive features
* **Drill down** — Click any metric or chart bar to see underlying tickets.
* **Download** — Export data from any chart or table.
* **Copy values** — Click any metric to copy to clipboard.
* **AI assistant** — Ask questions about your data. See [Using reports](/reports/using-reports#ai-assistant).
Complete list of every ticket. Download for detailed analysis.
## Interactive features
* **Drill down** — Click any metric or chart bar to see underlying tickets.
* **Download** — Export data from any chart or table.
* **Copy values** — Click any metric to copy to clipboard.
* **AI assistant** — Ask questions about your data. See [Using reports](/reports/using-reports#ai-assistant).