> ## Documentation Index
> Fetch the complete documentation index at: https://help.atlas.kitchen/llms.txt
> Use this file to discover all available pages before exploring further.
# Loyalty report
> Track loyalty program signups, points activity, and member value.
**Available for:** Manager Finance Admin
[Go to report →](https://portal.atlas.kitchen/analytics/loyalty)
## What this report shows
Loyalty program performance including signups, points earned and spent, member retention, and lifetime value comparison between members and non-members.
Data refreshes hourly. Last refresh time appears at the top.
## Filters
 * **Date** — Date range. Defaults to past 3 months.
* **First order brand** — Filter by brand where customer first ordered.
* **First order outlet** — Filter by outlet where customer first ordered.
## Sections
### User summary and points summary
* **Date** — Date range. Defaults to past 3 months.
* **First order brand** — Filter by brand where customer first ordered.
* **First order outlet** — Filter by outlet where customer first ordered.
## Sections
### User summary and points summary
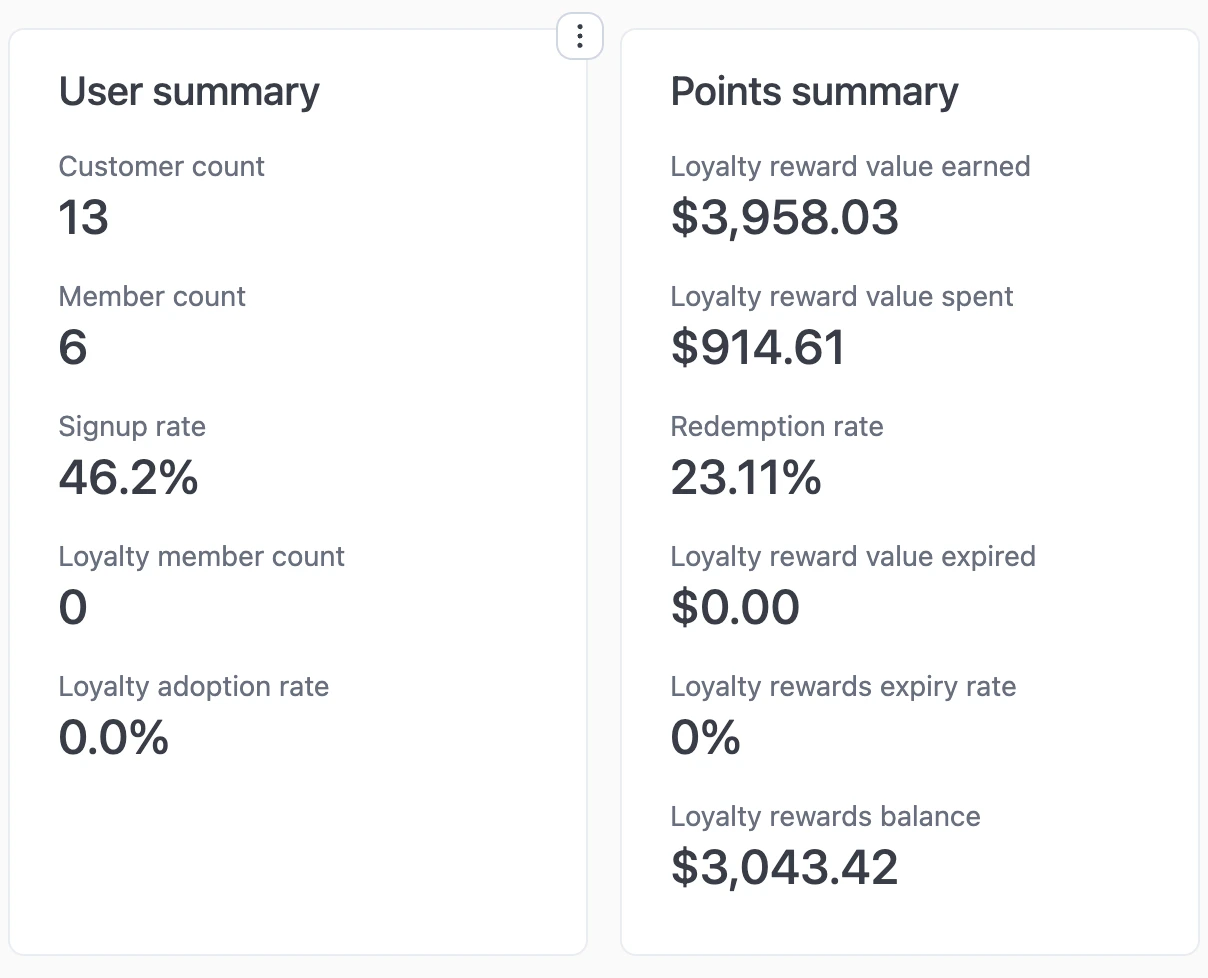 **User summary:**
* **Customer count** — Total customers in the filtered period.
* **Member count** — Customers who signed up (created an account).
* **Signup rate** — Member count ÷ customer count.
* **Loyalty member count** — Members enrolled in the loyalty program.
* **Loyalty adoption rate** — Loyalty members ÷ total members.
**Points summary:**
* **Loyalty reward value earned** — Total value of points earned.
* **Loyalty reward value spent** — Total value of points redeemed.
* **Redemption rate** — Value spent ÷ value earned.
* **Loyalty reward value expired** — Value of points that expired.
* **Loyalty rewards expiry rate** — Expired ÷ earned.
* **Loyalty rewards balance** — Outstanding points value (earned - spent - expired).
### AI insights
**User summary:**
* **Customer count** — Total customers in the filtered period.
* **Member count** — Customers who signed up (created an account).
* **Signup rate** — Member count ÷ customer count.
* **Loyalty member count** — Members enrolled in the loyalty program.
* **Loyalty adoption rate** — Loyalty members ÷ total members.
**Points summary:**
* **Loyalty reward value earned** — Total value of points earned.
* **Loyalty reward value spent** — Total value of points redeemed.
* **Redemption rate** — Value spent ÷ value earned.
* **Loyalty reward value expired** — Value of points that expired.
* **Loyalty rewards expiry rate** — Expired ÷ earned.
* **Loyalty rewards balance** — Outstanding points value (earned - spent - expired).
### AI insights
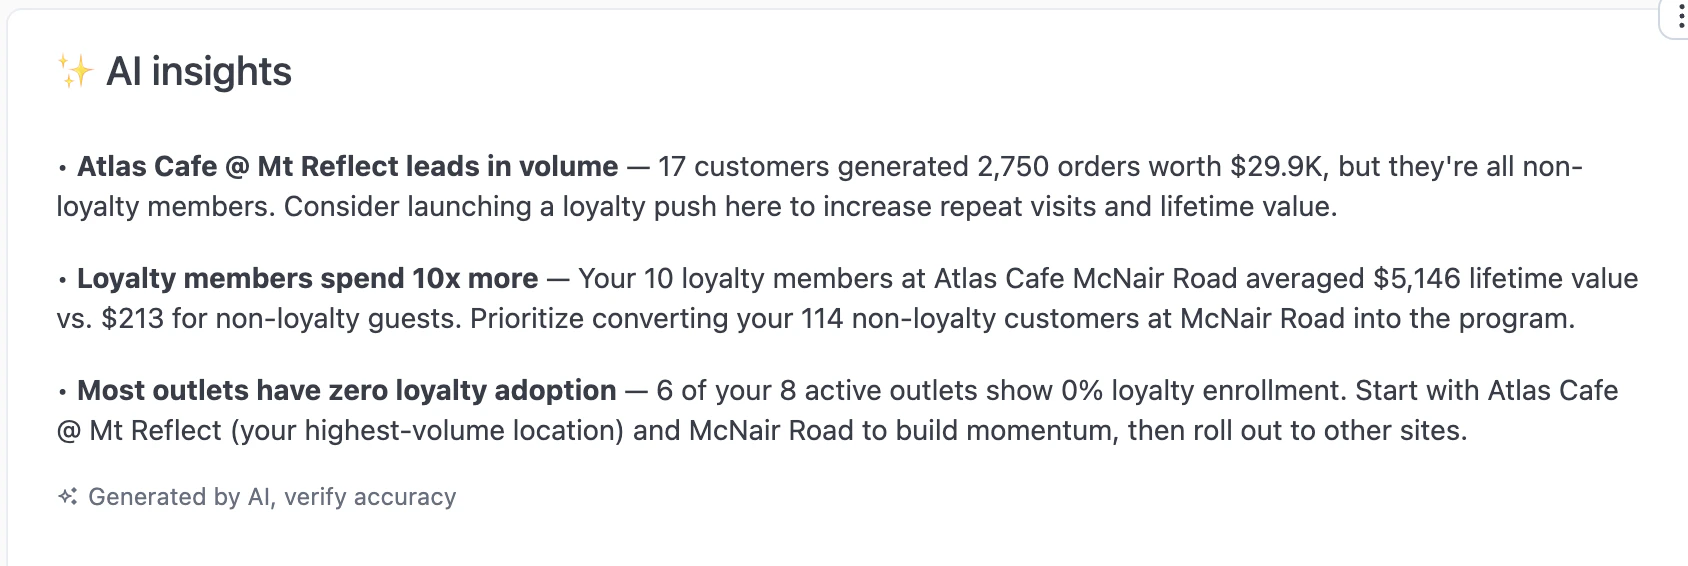 AI-generated analysis of loyalty program performance, highlighting high-value outlets, member vs non-member spending, and adoption opportunities.
### Points summary by source
Loyalty points activity broken down by order source.
### % orders from members (weekly)
AI-generated analysis of loyalty program performance, highlighting high-value outlets, member vs non-member spending, and adoption opportunities.
### Points summary by source
Loyalty points activity broken down by order source.
### % orders from members (weekly)
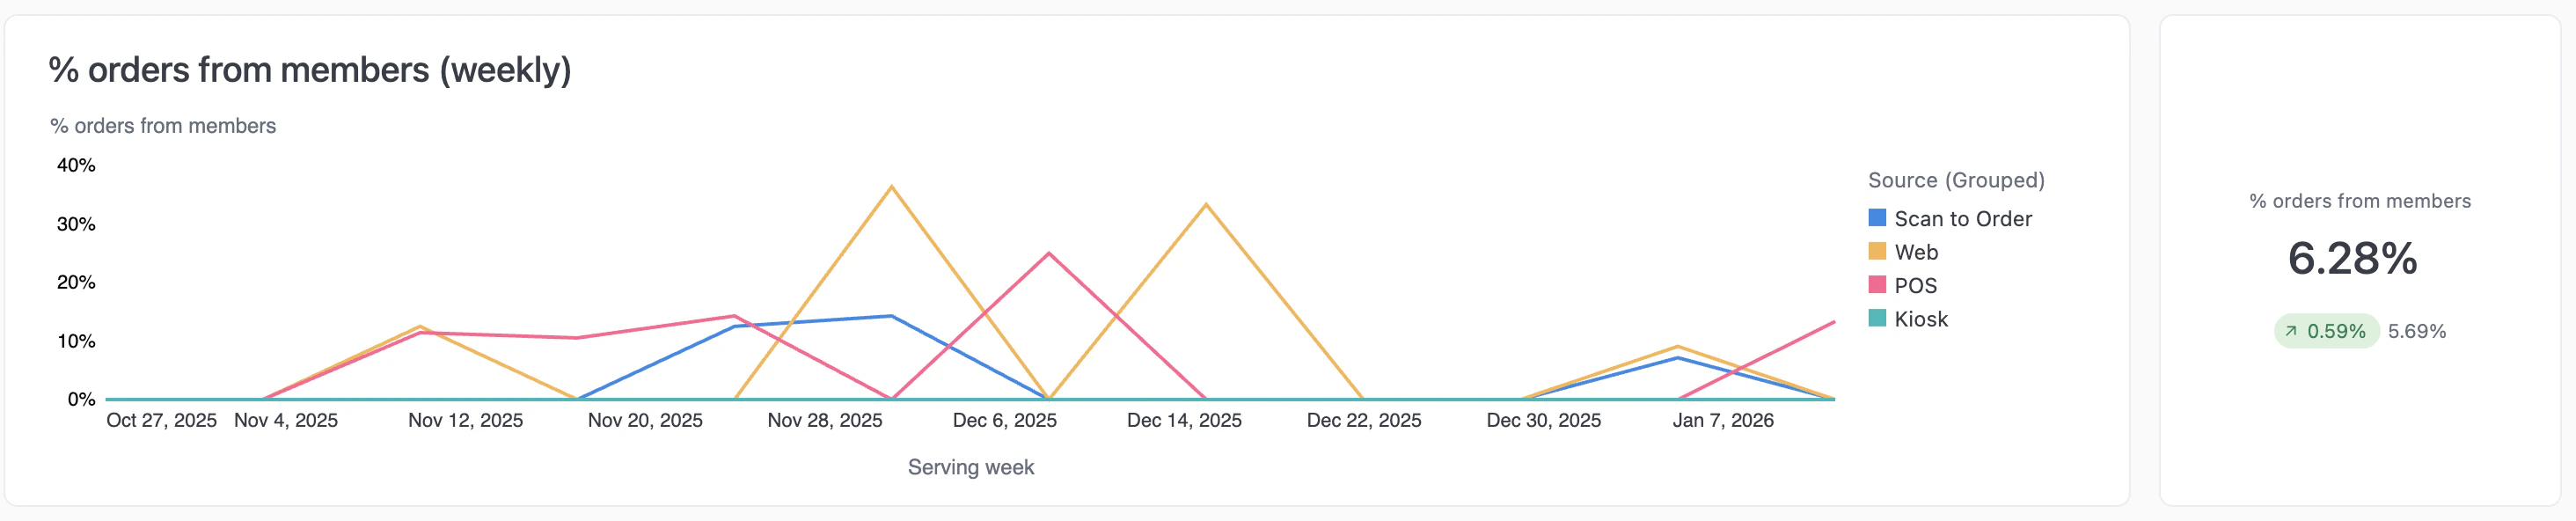 What percentage of orders come from members (vs guests), broken down by order source. Higher percentages indicate stronger member engagement.
### % of orders with points earned (weekly)
What percentage of orders come from members (vs guests), broken down by order source. Higher percentages indicate stronger member engagement.
### % of orders with points earned (weekly)
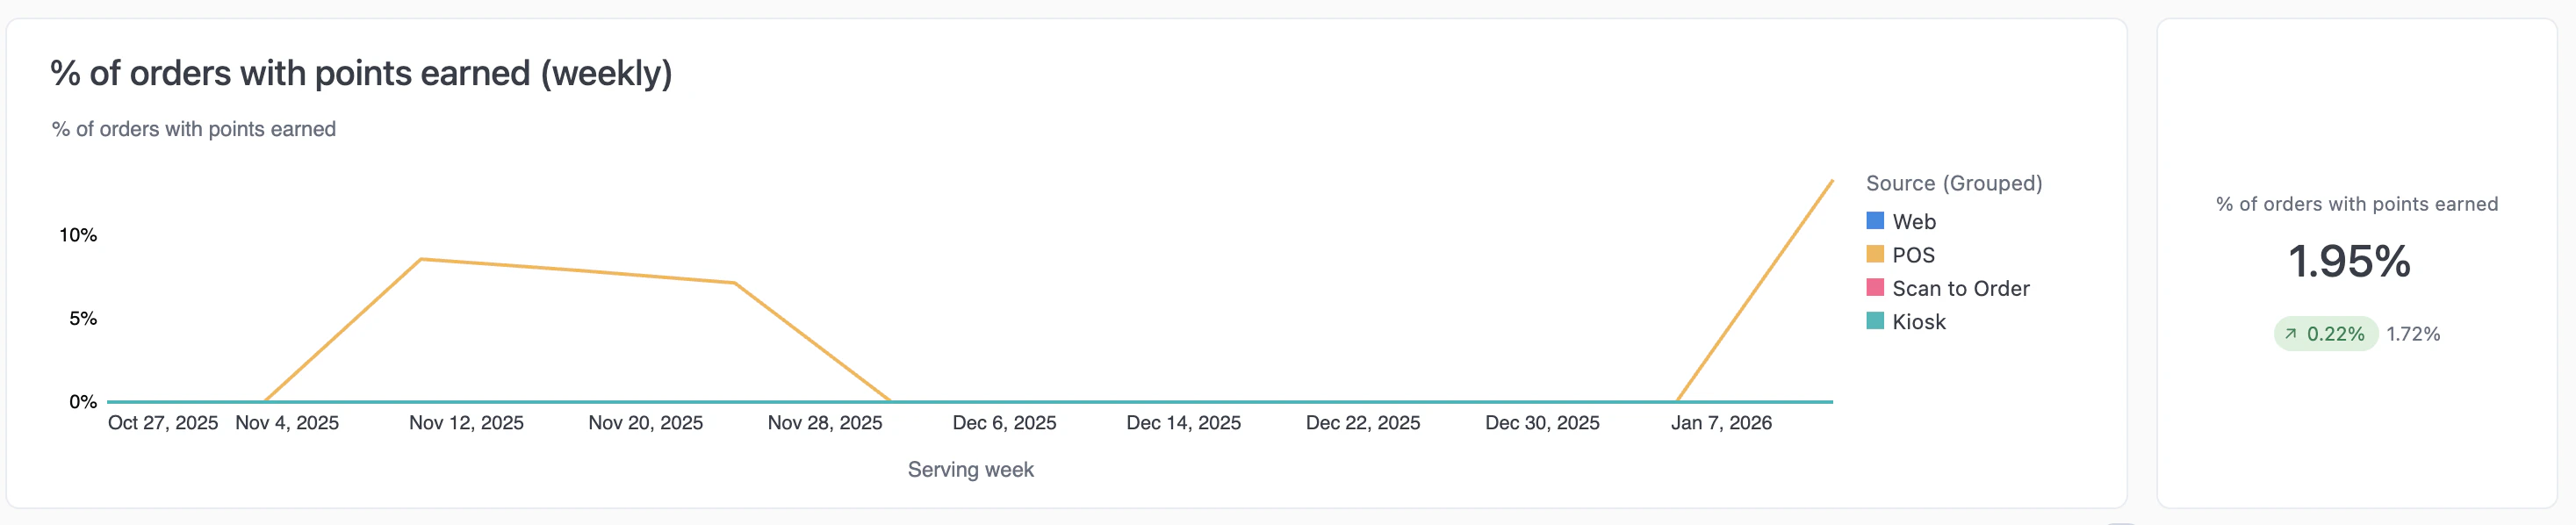 What percentage of orders earned loyalty points. Low percentages may indicate members aren't logging in or points aren't being awarded correctly.
### % of orders with points spent (weekly)
What percentage of orders earned loyalty points. Low percentages may indicate members aren't logging in or points aren't being awarded correctly.
### % of orders with points spent (weekly)
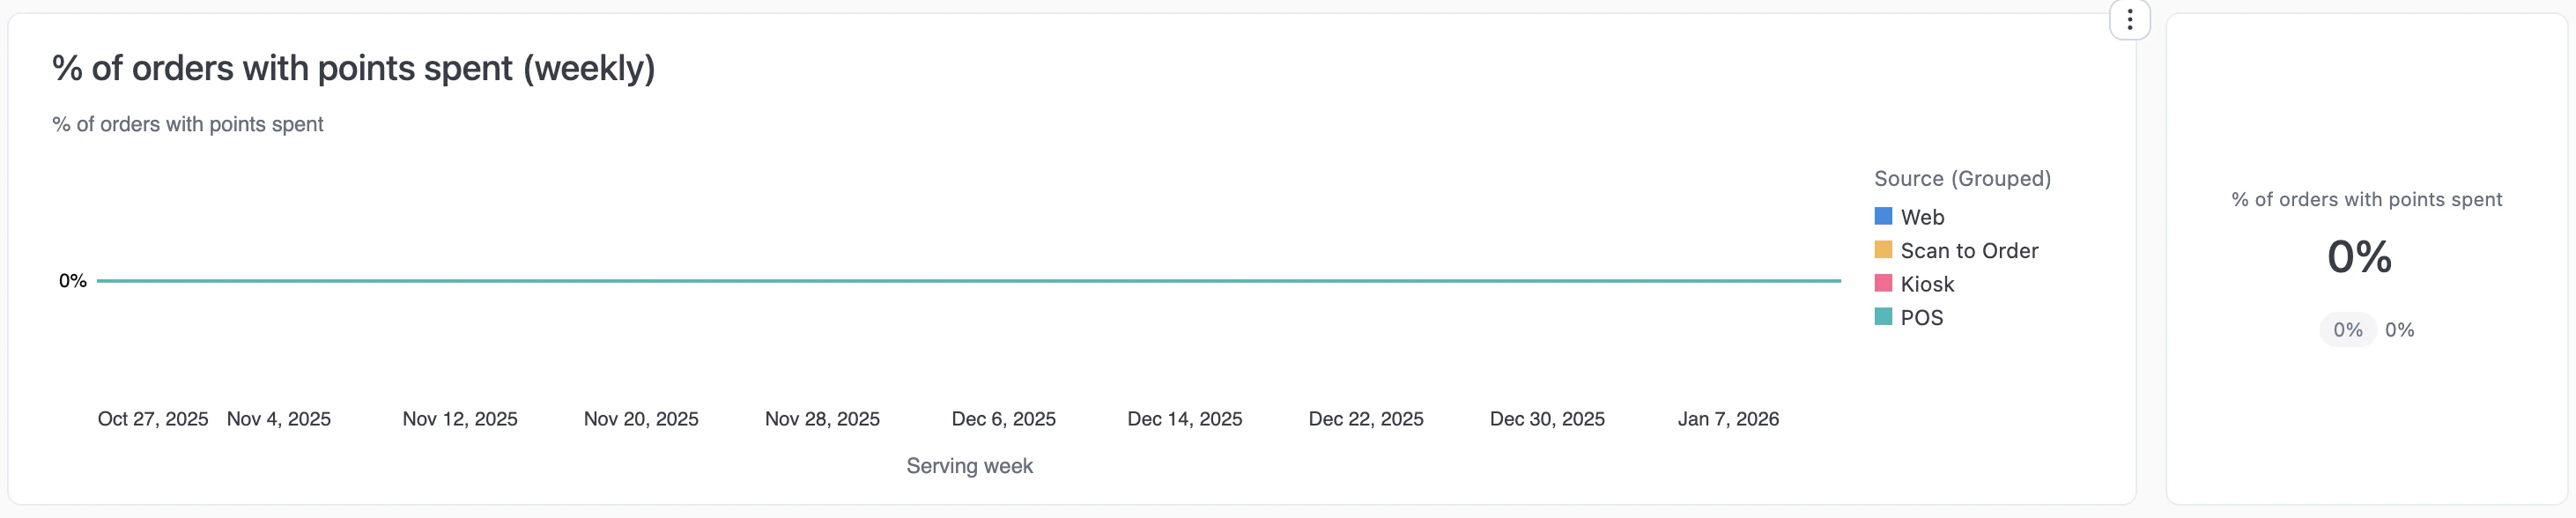 What percentage of orders used points for redemption. Track whether members are actively using their rewards.
### Signup rate (monthly)
What percentage of orders used points for redemption. Track whether members are actively using their rewards.
### Signup rate (monthly)
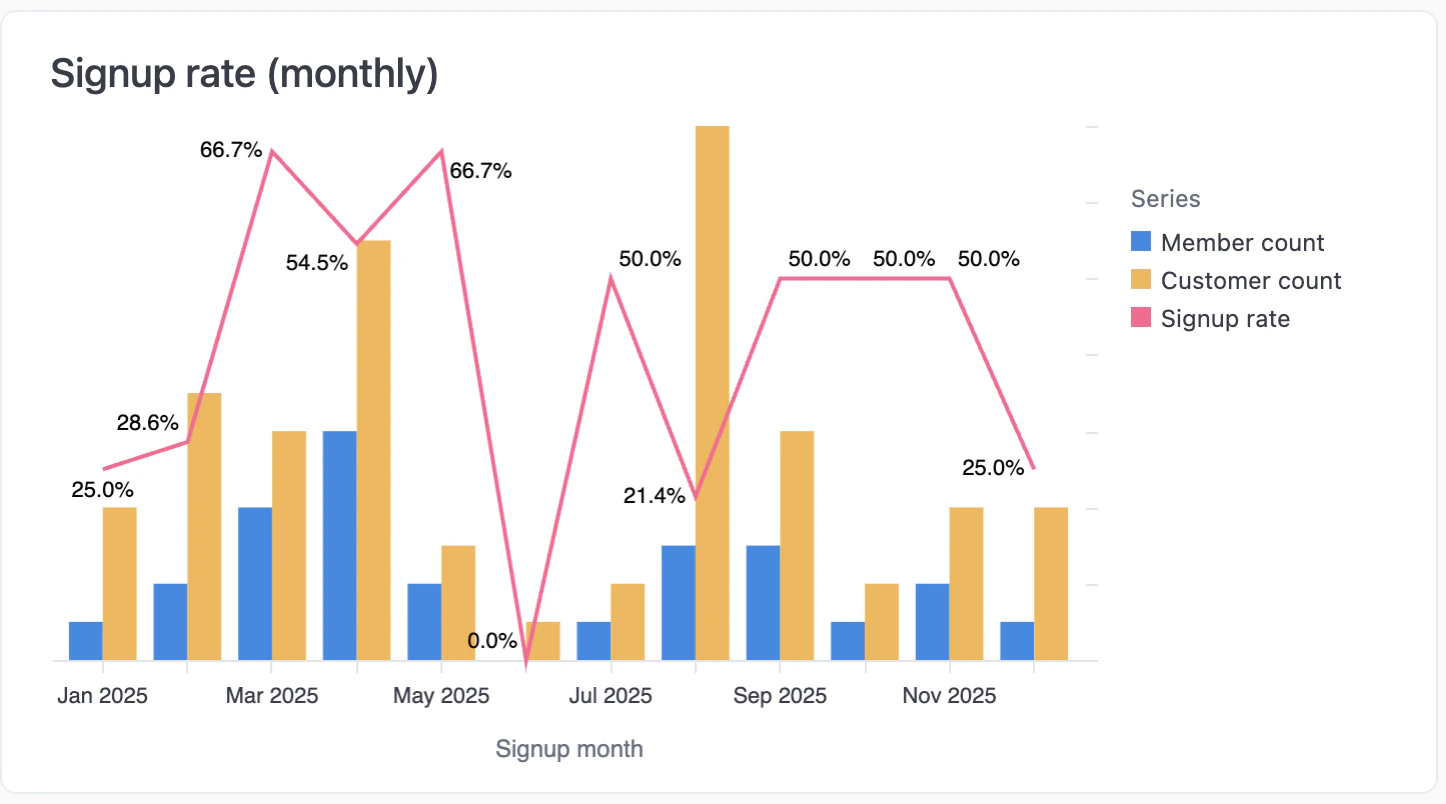 Monthly signup conversion rate. Blue bars show member signups, orange bars show total customers, pink line shows signup rate percentage.
### Lifetime value by loyalty status
Monthly signup conversion rate. Blue bars show member signups, orange bars show total customers, pink line shows signup rate percentage.
### Lifetime value by loyalty status
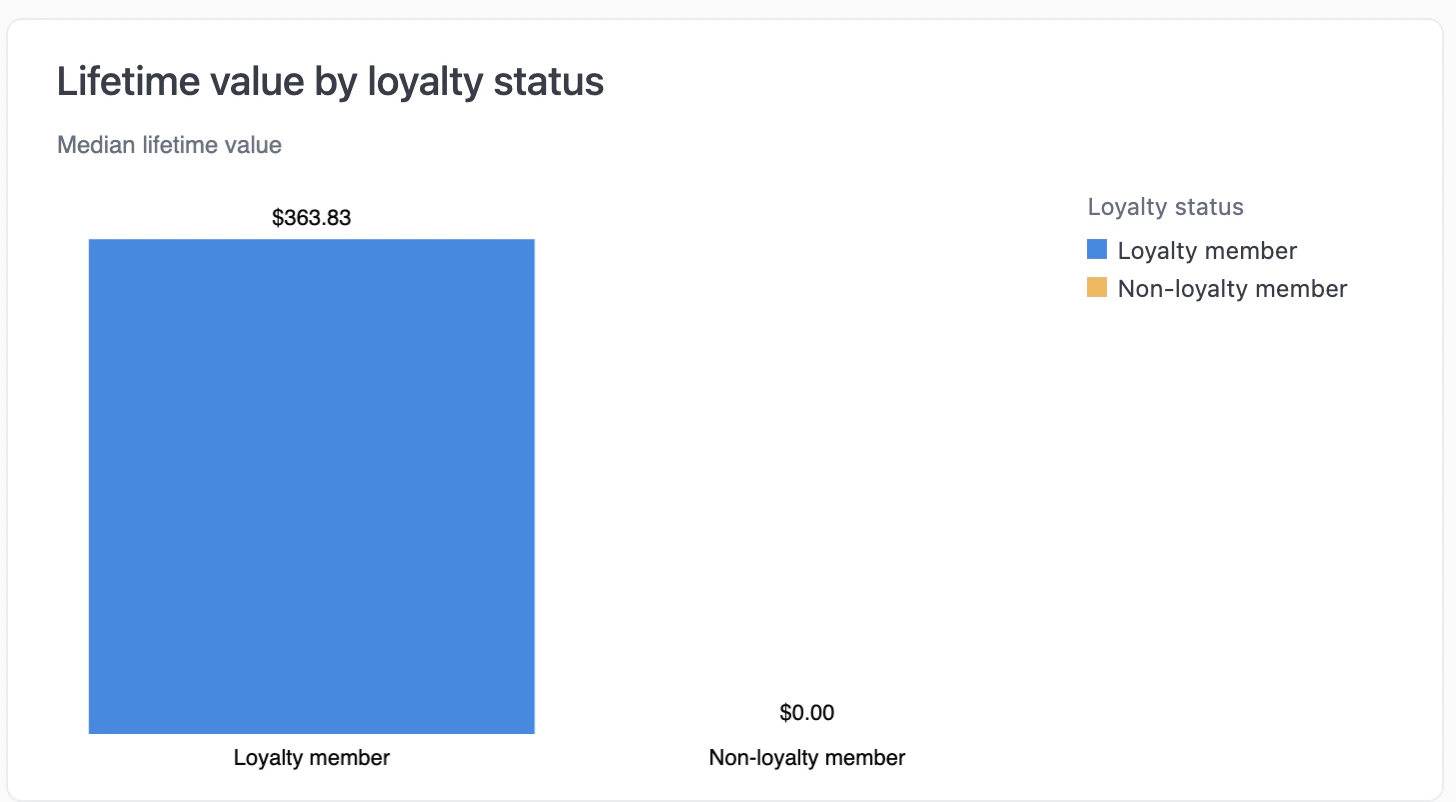 Median lifetime value comparison between loyalty members and non-members. Use this to quantify the value of your loyalty program.
### User retention by loyalty status
Median lifetime value comparison between loyalty members and non-members. Use this to quantify the value of your loyalty program.
### User retention by loyalty status
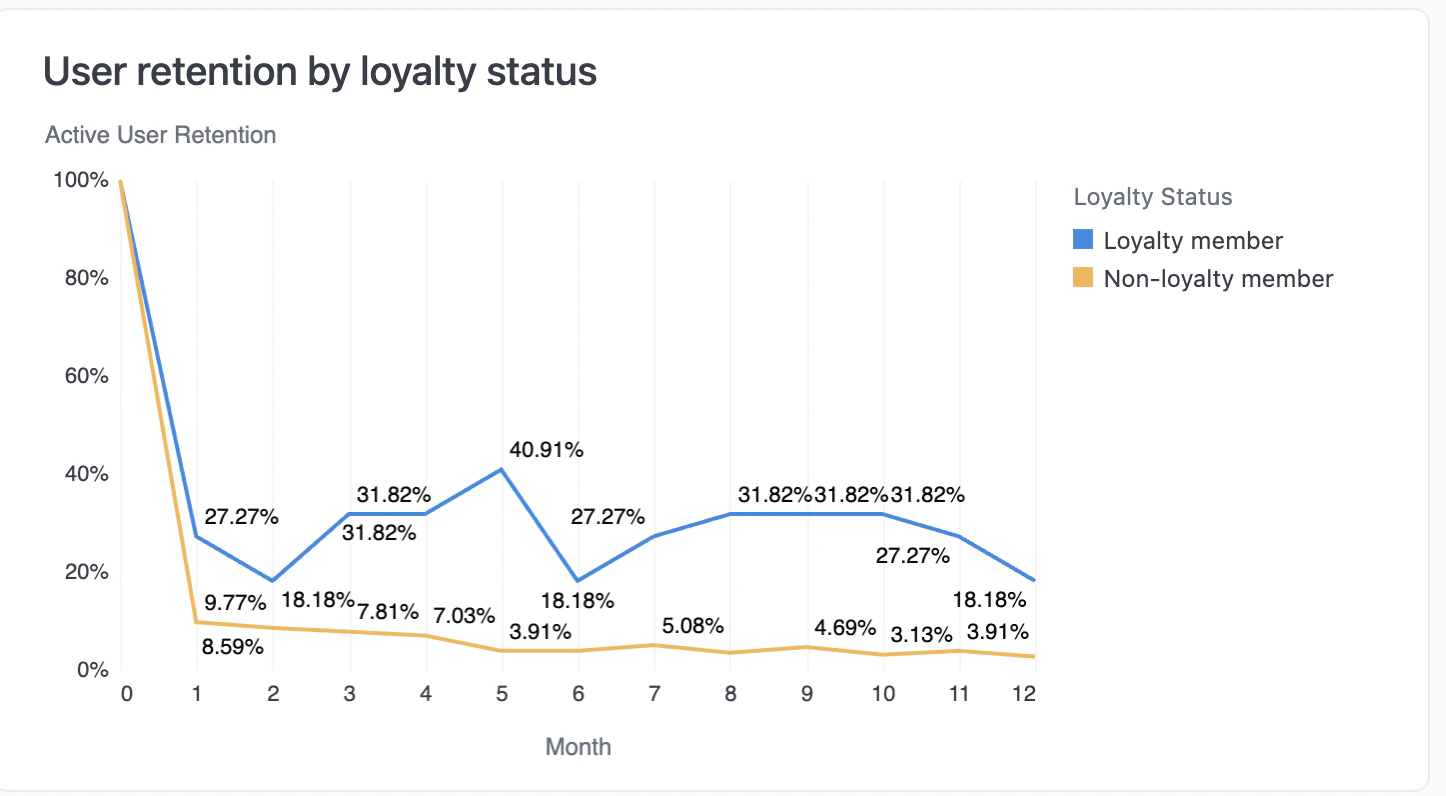 How well you retain loyalty members vs non-members over time. Higher retention among loyalty members validates the program's effectiveness.
### Members by activity status
How well you retain loyalty members vs non-members over time. Higher retention among loyalty members validates the program's effectiveness.
### Members by activity status
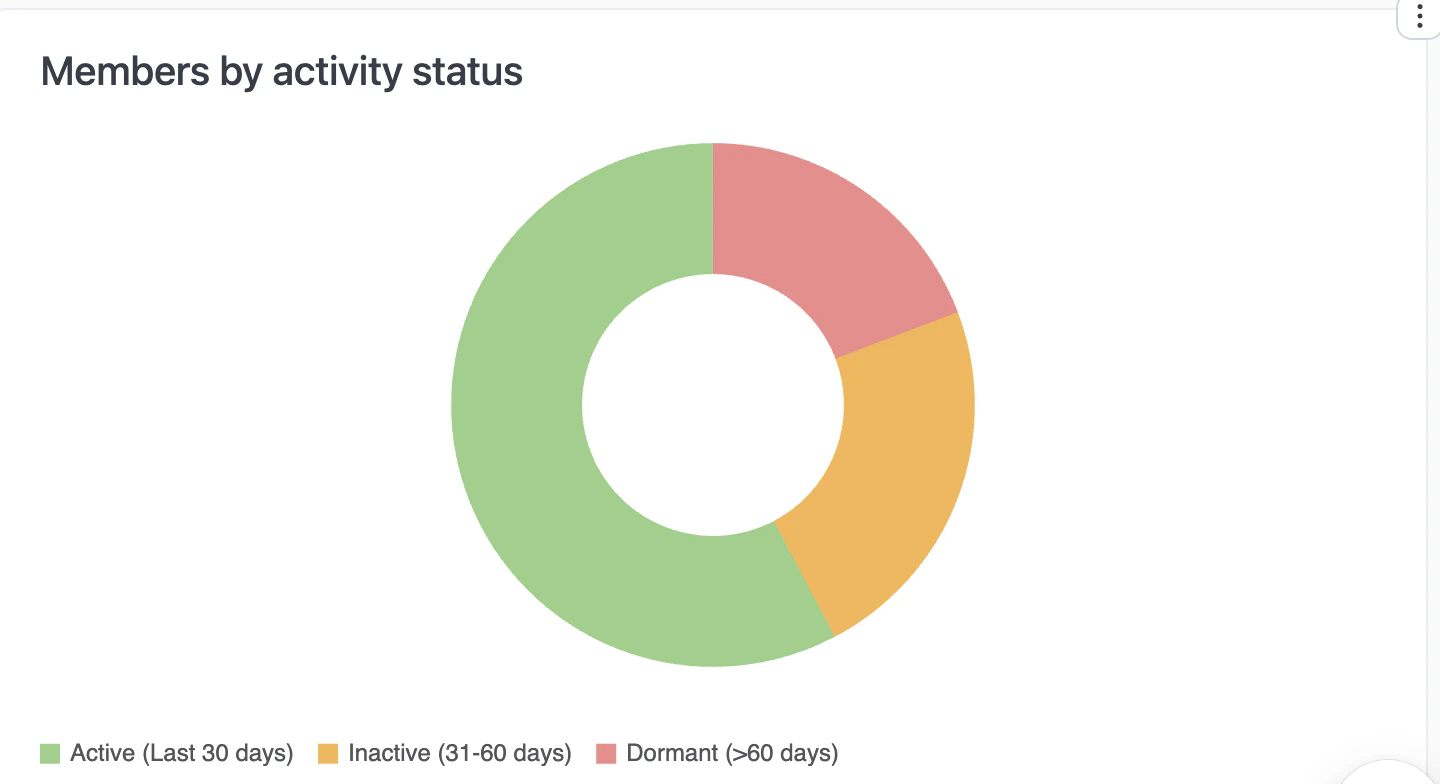 Current member breakdown by activity:
* **Active (Last 30 days)** — Ordered recently.
* **Inactive (31-60 days)** — No orders in 31-60 days.
* **Dormant (>60 days)** — No orders in over 60 days.
## Interactive features
* **Drill down** — Click any metric or chart to see underlying data.
* **Download** — Export data from any chart or table.
* **Copy values** — Click any metric to copy to clipboard.
* **AI assistant** — Ask questions about your data. See [Using reports](/reports/using-reports#ai-assistant).
Current member breakdown by activity:
* **Active (Last 30 days)** — Ordered recently.
* **Inactive (31-60 days)** — No orders in 31-60 days.
* **Dormant (>60 days)** — No orders in over 60 days.
## Interactive features
* **Drill down** — Click any metric or chart to see underlying data.
* **Download** — Export data from any chart or table.
* **Copy values** — Click any metric to copy to clipboard.
* **AI assistant** — Ask questions about your data. See [Using reports](/reports/using-reports#ai-assistant).