> ## Documentation Index
> Fetch the complete documentation index at: https://help.atlas.kitchen/llms.txt
> Use this file to discover all available pages before exploring further.
# Discount report
> Track promo code usage, discount costs, and effectiveness.
**Available for:** Manager Finance Admin
[Go to report →](https://portal.atlas.kitchen/analytics/discounts)
## What this report shows
Which promo codes are used most, how much they cost, and where discounts concentrate by outlet, time of day, source, and product category.
Data refreshes hourly. Last refresh time appears at the top.
## Filters
 * **Serving date** — Date range. Defaults to past 30 days.
* **Outlet** — Filter by outlet.
* **Fulfilment type** — Dine-in, Pickup, Delivery.
* **Source** — Order source (POS, Kiosk, Web, etc.).
* **Promo code** — Filter by specific promo code.
* **Reason** — Filter by discount reason.
## Sections
### Key metrics
* **Serving date** — Date range. Defaults to past 30 days.
* **Outlet** — Filter by outlet.
* **Fulfilment type** — Dine-in, Pickup, Delivery.
* **Source** — Order source (POS, Kiosk, Web, etc.).
* **Promo code** — Filter by specific promo code.
* **Reason** — Filter by discount reason.
## Sections
### Key metrics
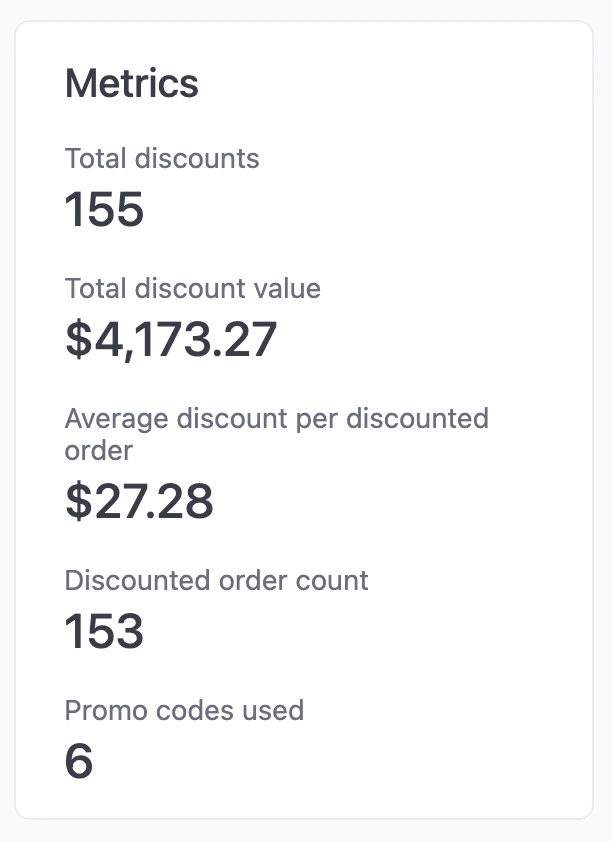 * **Total discounts** — Count of orders that received a discount.
* **Total discount value** — Sum of all discount amounts.
* **Average discount per discounted order** — Total discount value ÷ total discounts.
### AI summary
* **Total discounts** — Count of orders that received a discount.
* **Total discount value** — Sum of all discount amounts.
* **Average discount per discounted order** — Total discount value ÷ total discounts.
### AI summary
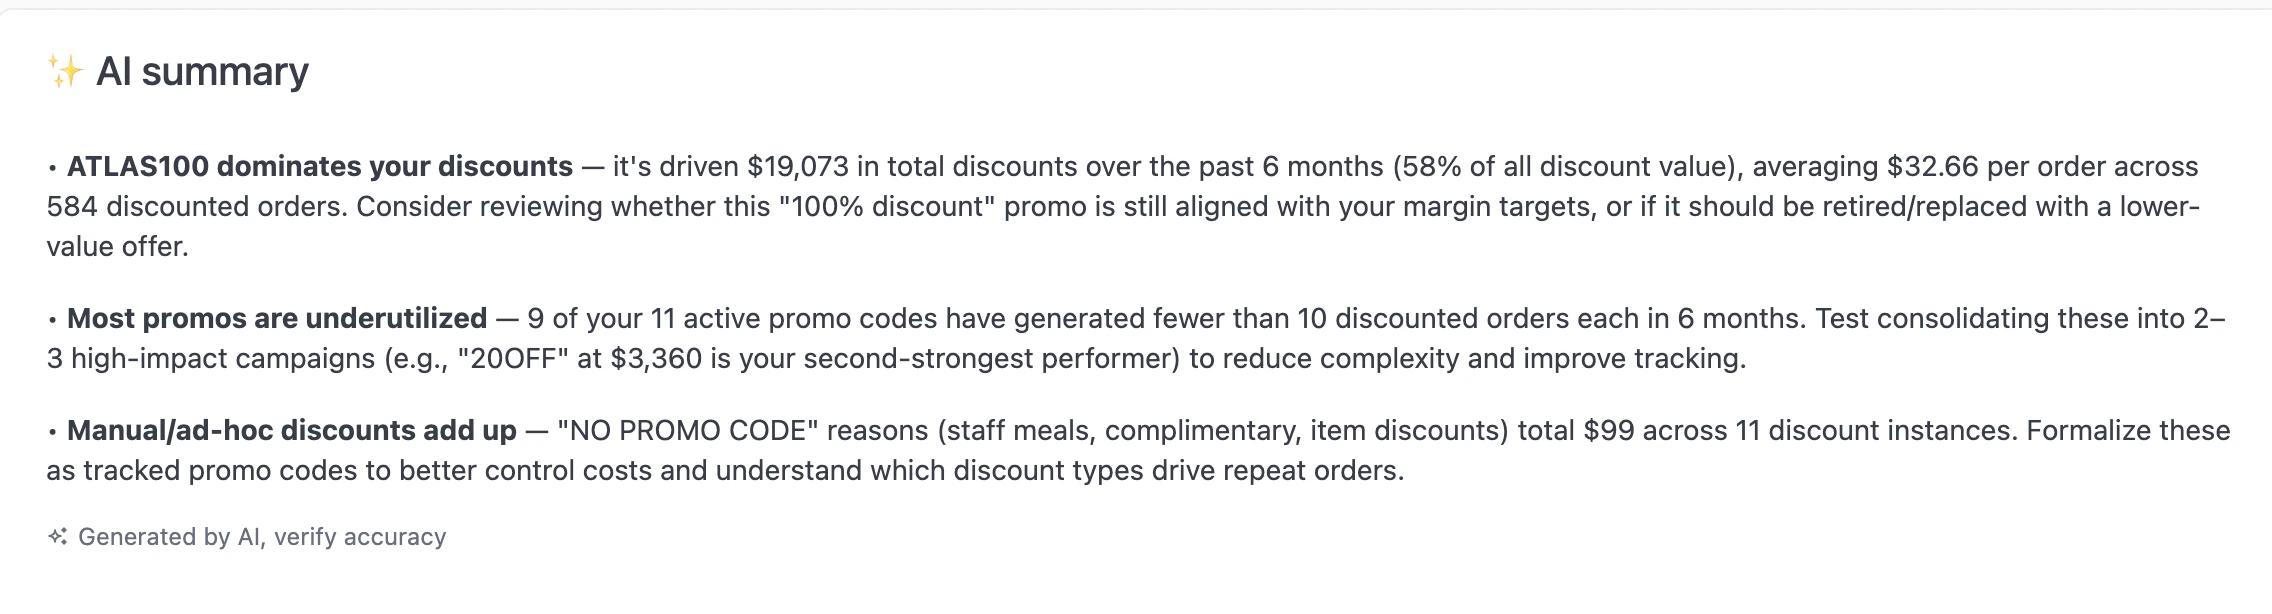 AI-generated insights about discount performance, top codes, and margin impact.
### Top discounts
AI-generated insights about discount performance, top codes, and margin impact.
### Top discounts
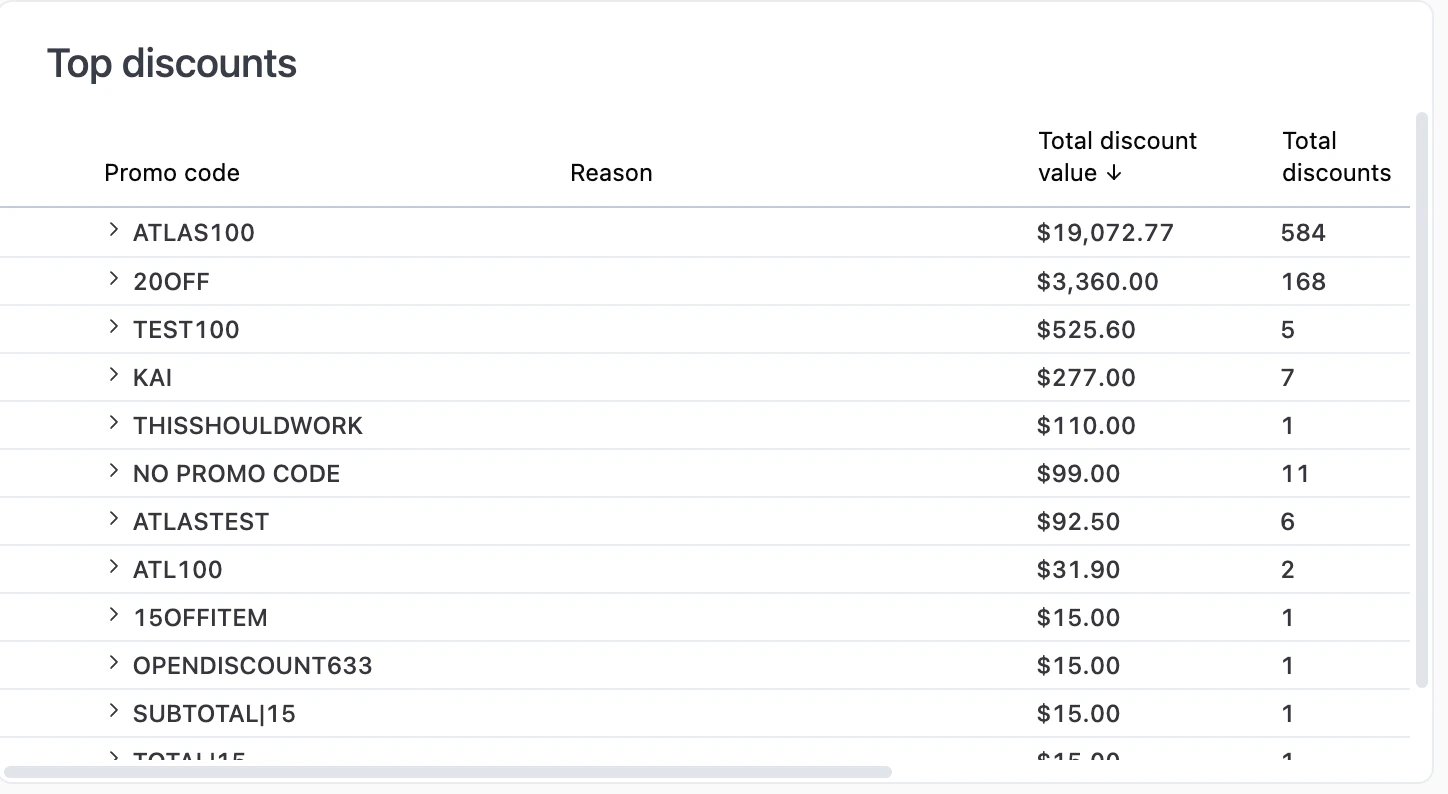 Promo codes ranked by usage count. Click any row to expand and see code details.
### Active discounts
Promo codes ranked by usage count. Click any row to expand and see code details.
### Active discounts
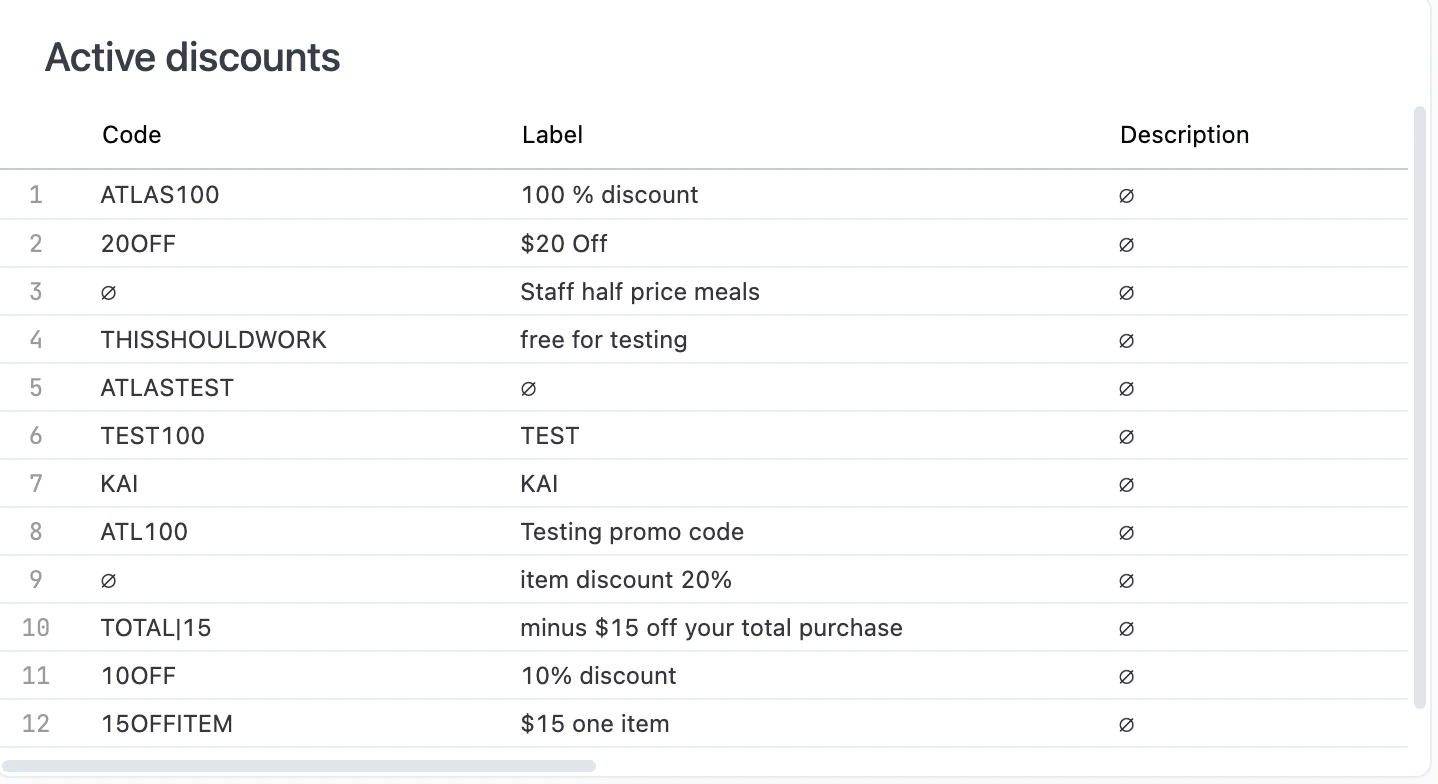 Currently enabled discount codes. Right-click any code to edit the discount or copy the value.
### Discount usage by hour of day
Currently enabled discount codes. Right-click any code to edit the discount or copy the value.
### Discount usage by hour of day
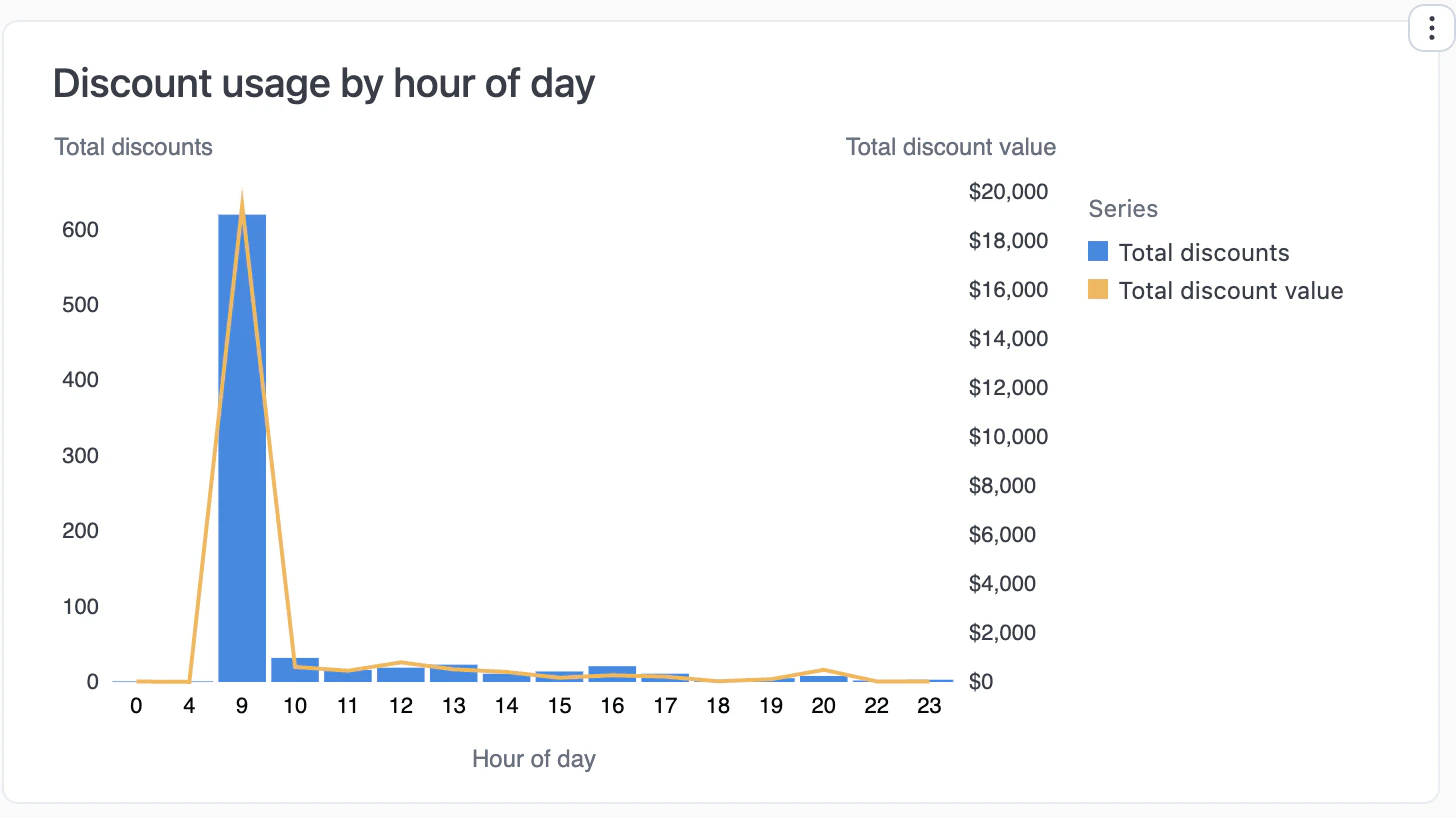 When discounts are used most. Blue bars show count (left axis), orange line shows total value (right axis).
### Discounts by outlet
When discounts are used most. Blue bars show count (left axis), orange line shows total value (right axis).
### Discounts by outlet
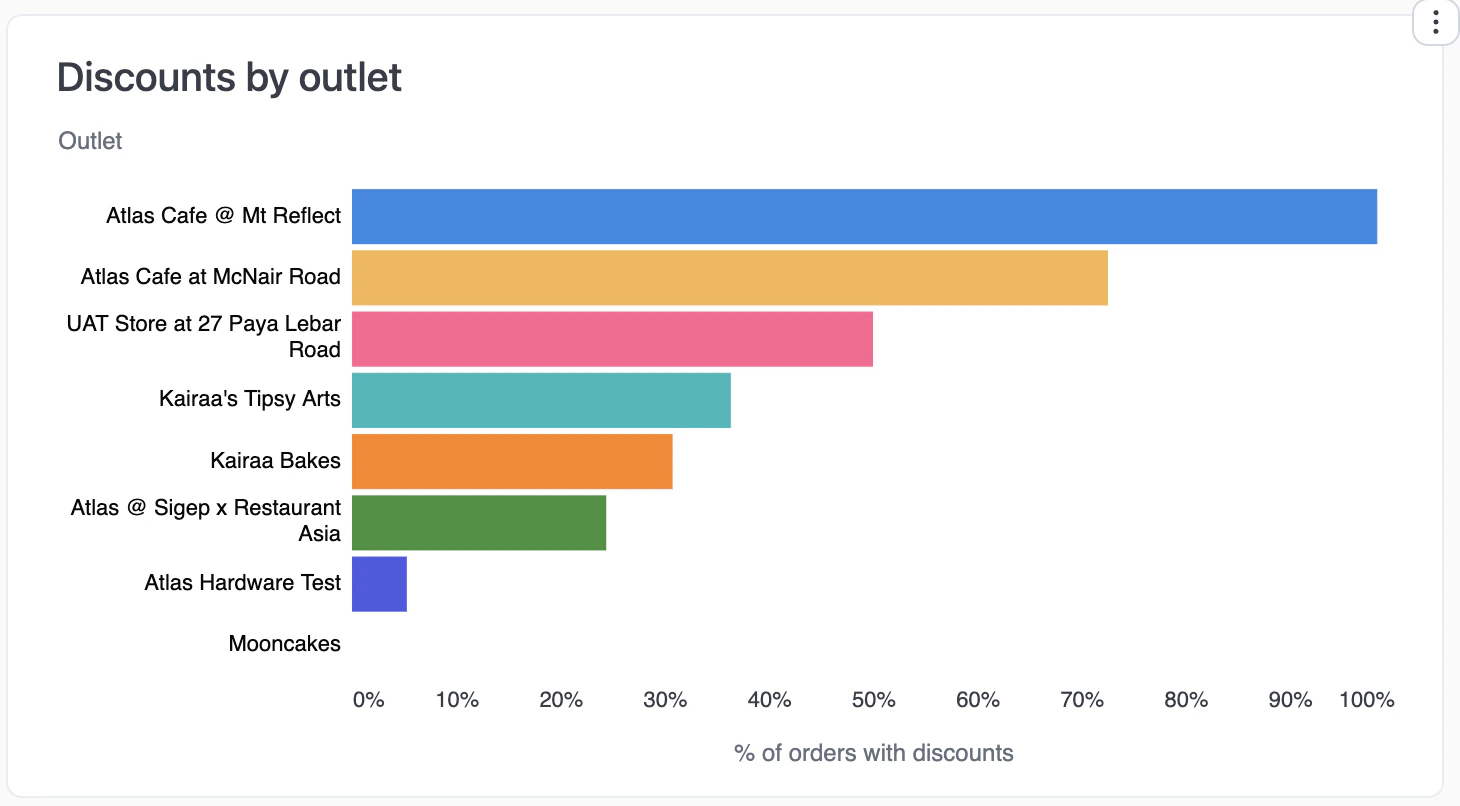 Percentage of orders with discounts at each outlet. High percentages may indicate over-reliance on discounts.
### Discounts by source
Percentage of orders with discounts at each outlet. High percentages may indicate over-reliance on discounts.
### Discounts by source
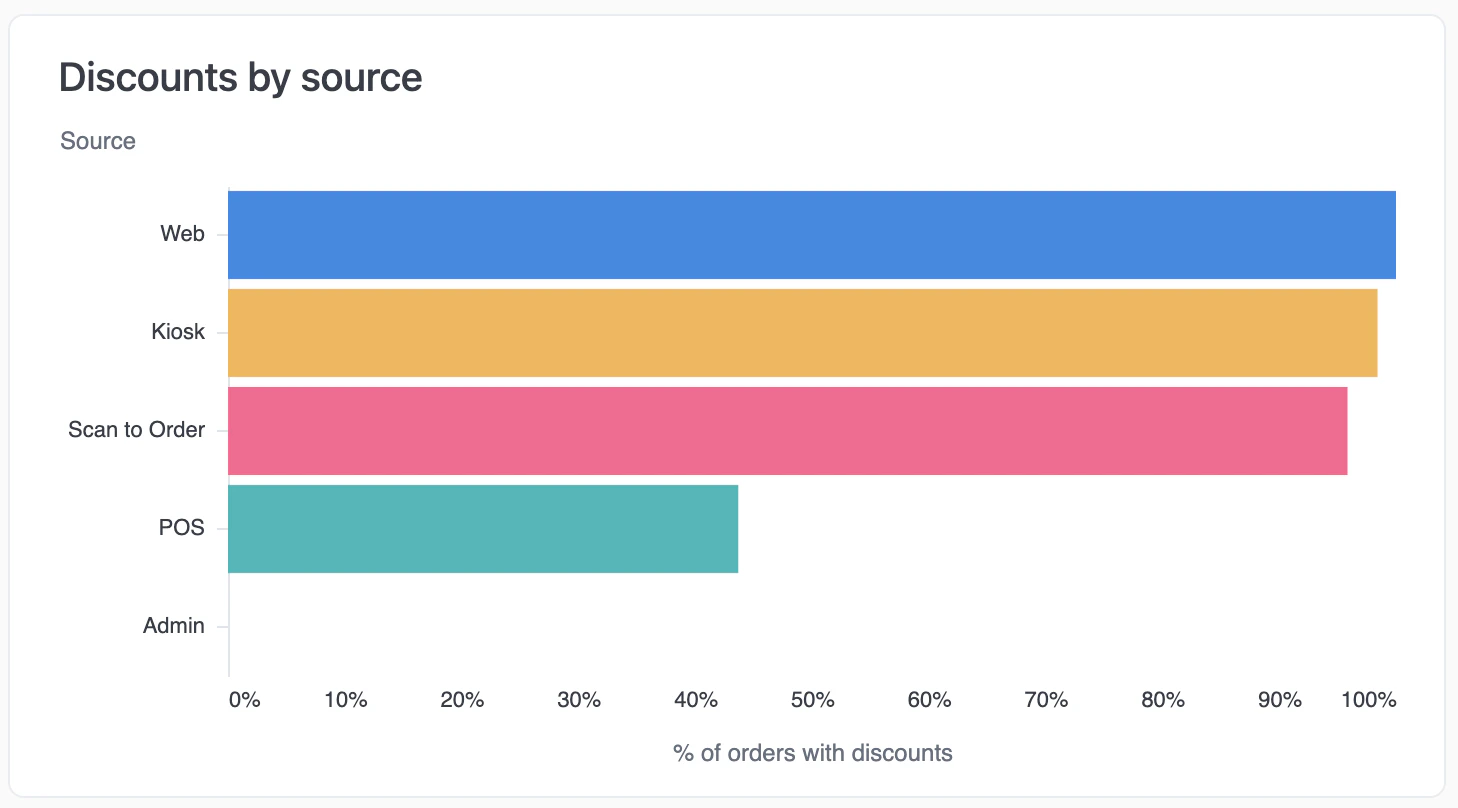
 Percentage of orders with discounts by channel (Scan to Order, Web, Kiosk, POS).
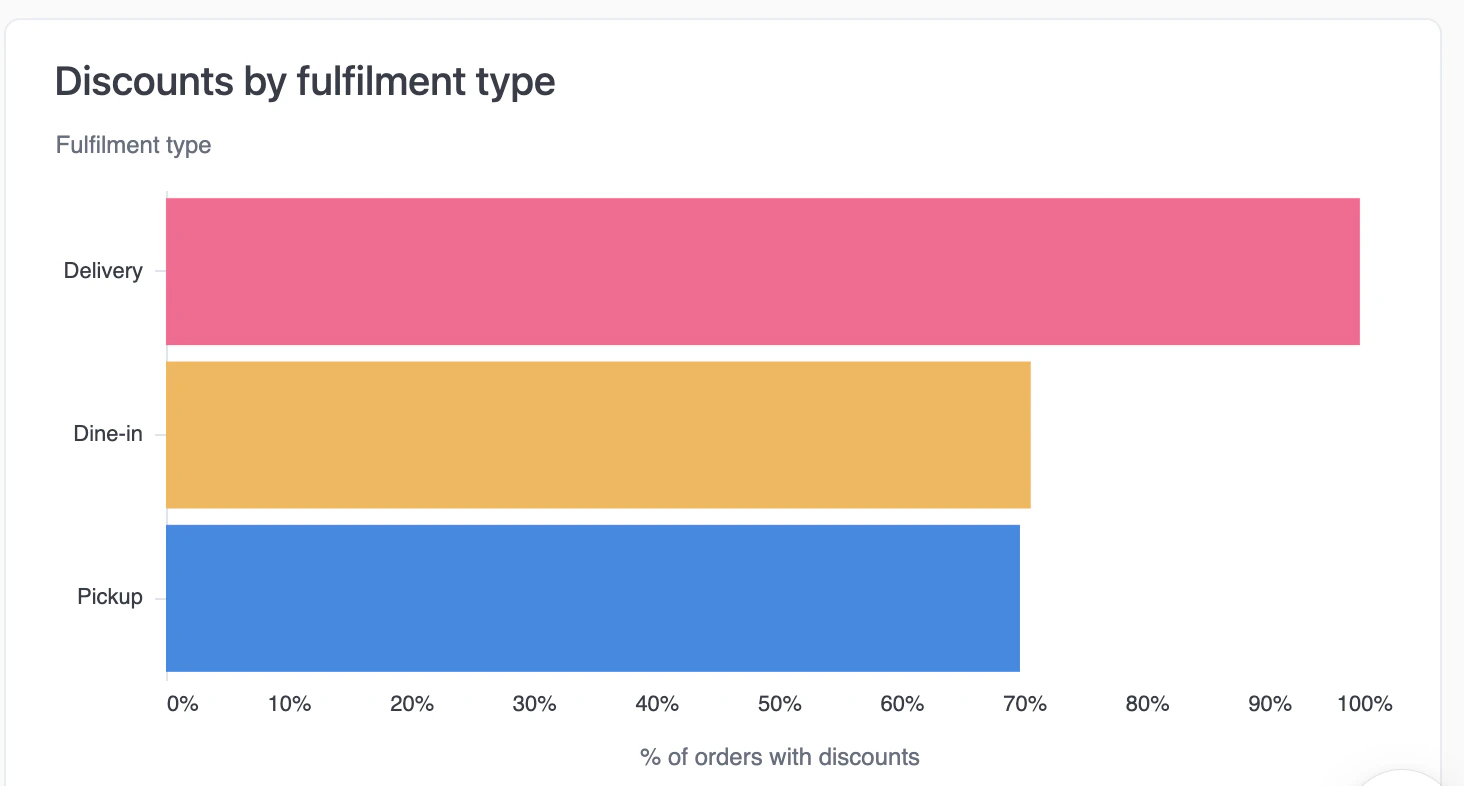
### Discounts by fulfilment type
Percentage of orders with discounts by channel (Scan to Order, Web, Kiosk, POS).
### Discounts by fulfilment type
 Percentage of orders with discounts by order type (Delivery, Dine-in, Pickup).
### Item discounts by category
Percentage of orders with discounts by order type (Delivery, Dine-in, Pickup).
### Item discounts by category
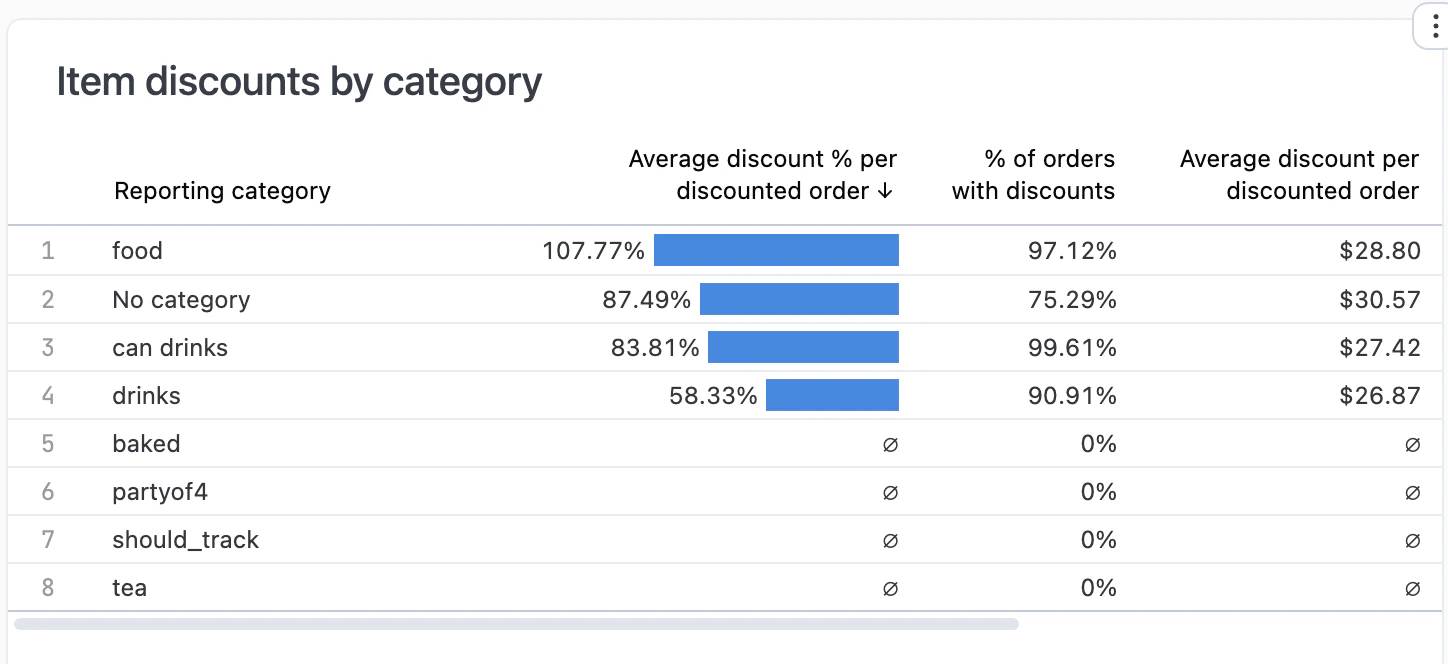 Average discount percentage by product category.
Values over 100% mean discounts exceeded revenue for that category—typically loss-leader pricing.
To set up categories, edit your product on the [Products page](https://portal.atlas.kitchen/products) and set its **Reporting category**.
### Item discounts
Average discount percentage by product category.
Values over 100% mean discounts exceeded revenue for that category—typically loss-leader pricing.
To set up categories, edit your product on the [Products page](https://portal.atlas.kitchen/products) and set its **Reporting category**.
### Item discounts
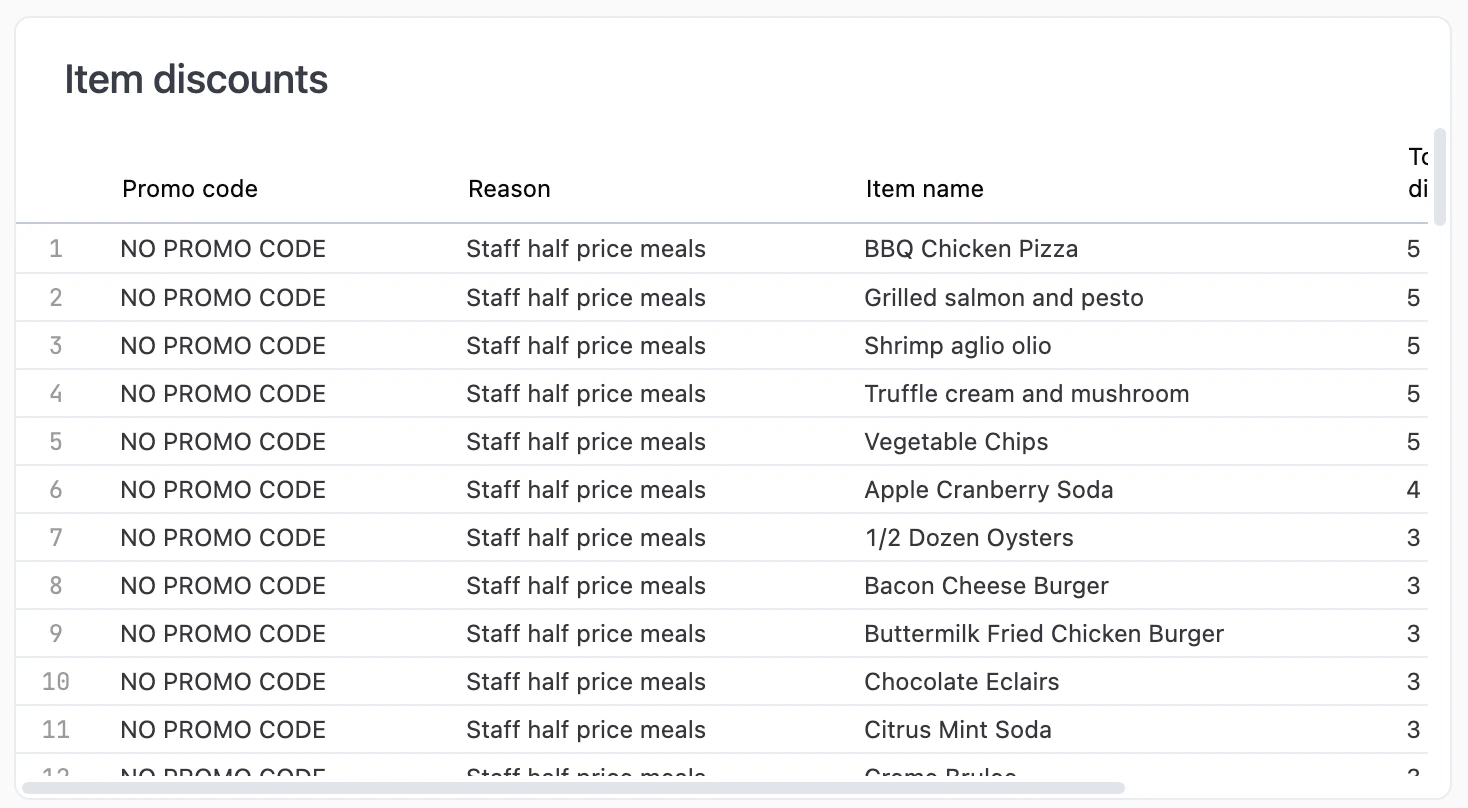
 Individual item-level discounts. If this shows "No Results", only order-level or promo code discounts were applied during the filtered period.
## Interactive features
* **Drill down** — Click any metric or chart bar to see underlying data.
* **Download** — Export data from any chart or table.
* **Copy values** — Click any metric to copy to clipboard.
* **AI assistant** — Ask questions about your data. See [Using reports](/reports/using-reports#ai-assistant).
Individual item-level discounts. If this shows "No Results", only order-level or promo code discounts were applied during the filtered period.
## Interactive features
* **Drill down** — Click any metric or chart bar to see underlying data.
* **Download** — Export data from any chart or table.
* **Copy values** — Click any metric to copy to clipboard.
* **AI assistant** — Ask questions about your data. See [Using reports](/reports/using-reports#ai-assistant).