> ## Documentation Index
> Fetch the complete documentation index at: https://help.atlas.kitchen/llms.txt
> Use this file to discover all available pages before exploring further.
# Customers report
> Track customer segments, lifetime value, and retention.
**Available for:** Manager Finance Admin
[Go to report →](https://portal.atlas.kitchen/analytics/customers)
## What this report shows
Customer behaviour and value across your business. See who your best customers are, track retention cohorts, and identify segments needing attention.
Data refreshes hourly. Last refresh time appears at the top.
## Filters
 * **Type** — Guest, Member, or POS user.
* **Customer segment** — Filter by segment (VIP regulars, Slipping regulars, etc.).
* **First order outlet** — Where the customer first ordered.
* **Orders count** — Filter by number of orders.
* **Lifetime value** — Filter by total spend.
## Sections
### Key metrics
* **Type** — Guest, Member, or POS user.
* **Customer segment** — Filter by segment (VIP regulars, Slipping regulars, etc.).
* **First order outlet** — Where the customer first ordered.
* **Orders count** — Filter by number of orders.
* **Lifetime value** — Filter by total spend.
## Sections
### Key metrics
 * **Total customers** — All customers with change from last month.
* **Median lifetime value** — Middle value of all customer spend with change from 30 days ago.
* **New customers (30D)** — Customers who placed their first order in the last 30 days.
* **Active customers (30D)** — Customers who ordered in the last 30 days.
### AI insights
* **Total customers** — All customers with change from last month.
* **Median lifetime value** — Middle value of all customer spend with change from 30 days ago.
* **New customers (30D)** — Customers who placed their first order in the last 30 days.
* **Active customers (30D)** — Customers who ordered in the last 30 days.
### AI insights
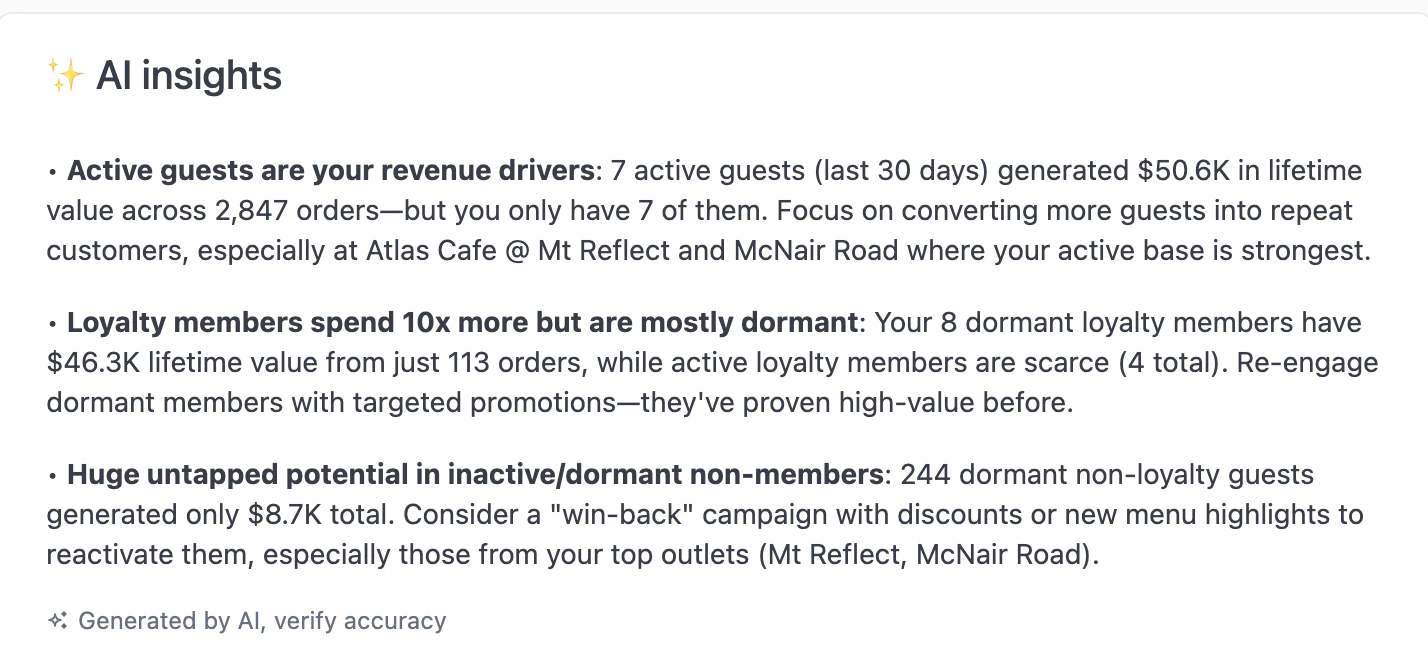 AI-generated analysis of customer patterns, highlighting revenue drivers, dormant high-value customers, and reactivation opportunities.
### Customer segmentation
AI-generated analysis of customer patterns, highlighting revenue drivers, dormant high-value customers, and reactivation opportunities.
### Customer segmentation
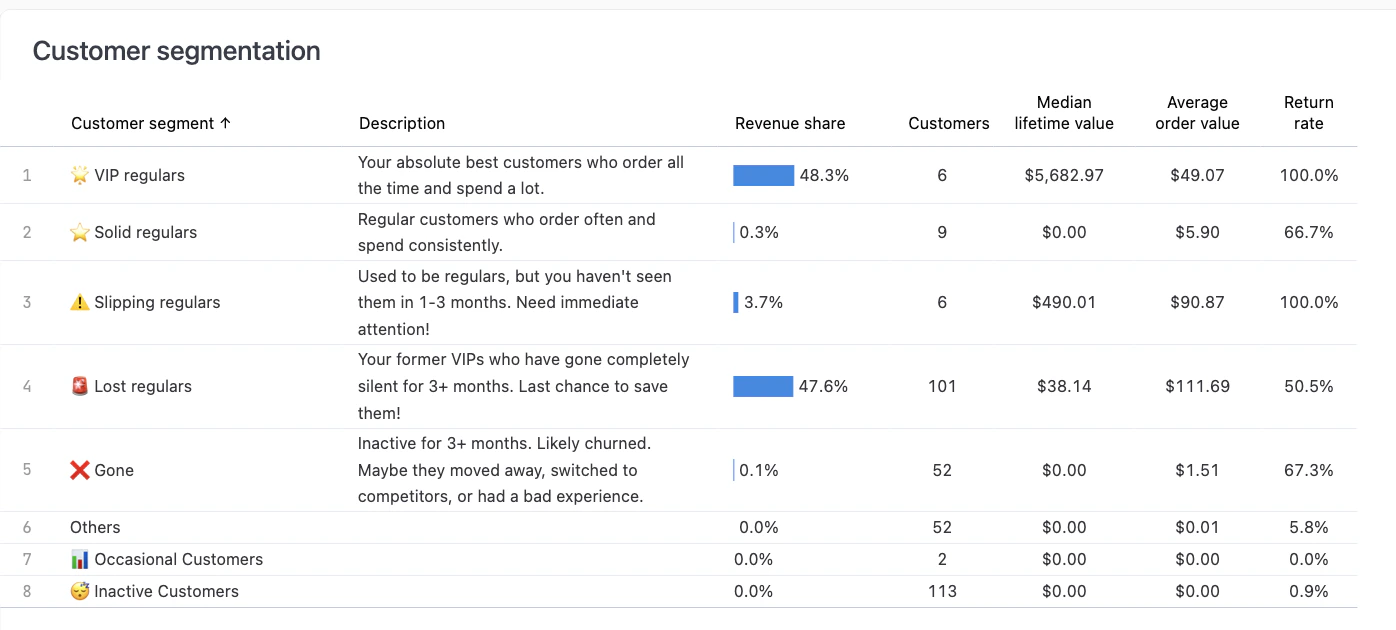 Pre-built segments based on ordering behaviour:
* **VIP regulars** — Order frequently and spend a lot.
* **Solid regulars** — Consistent ordering and spending.
* **Slipping regulars** — Former regulars not seen in 1-3 months.
* **Lost regulars** — Silent for 3+ months.
* **Gone** — Inactive 3+ months, likely churned.
* **Occasional Customers** — Infrequent orders.
* **Inactive Customers** — No recent activity.
**Columns:** Revenue share, customers, median lifetime value, average order value, return rate.
### Order count distribution
Pre-built segments based on ordering behaviour:
* **VIP regulars** — Order frequently and spend a lot.
* **Solid regulars** — Consistent ordering and spending.
* **Slipping regulars** — Former regulars not seen in 1-3 months.
* **Lost regulars** — Silent for 3+ months.
* **Gone** — Inactive 3+ months, likely churned.
* **Occasional Customers** — Infrequent orders.
* **Inactive Customers** — No recent activity.
**Columns:** Revenue share, customers, median lifetime value, average order value, return rate.
### Order count distribution
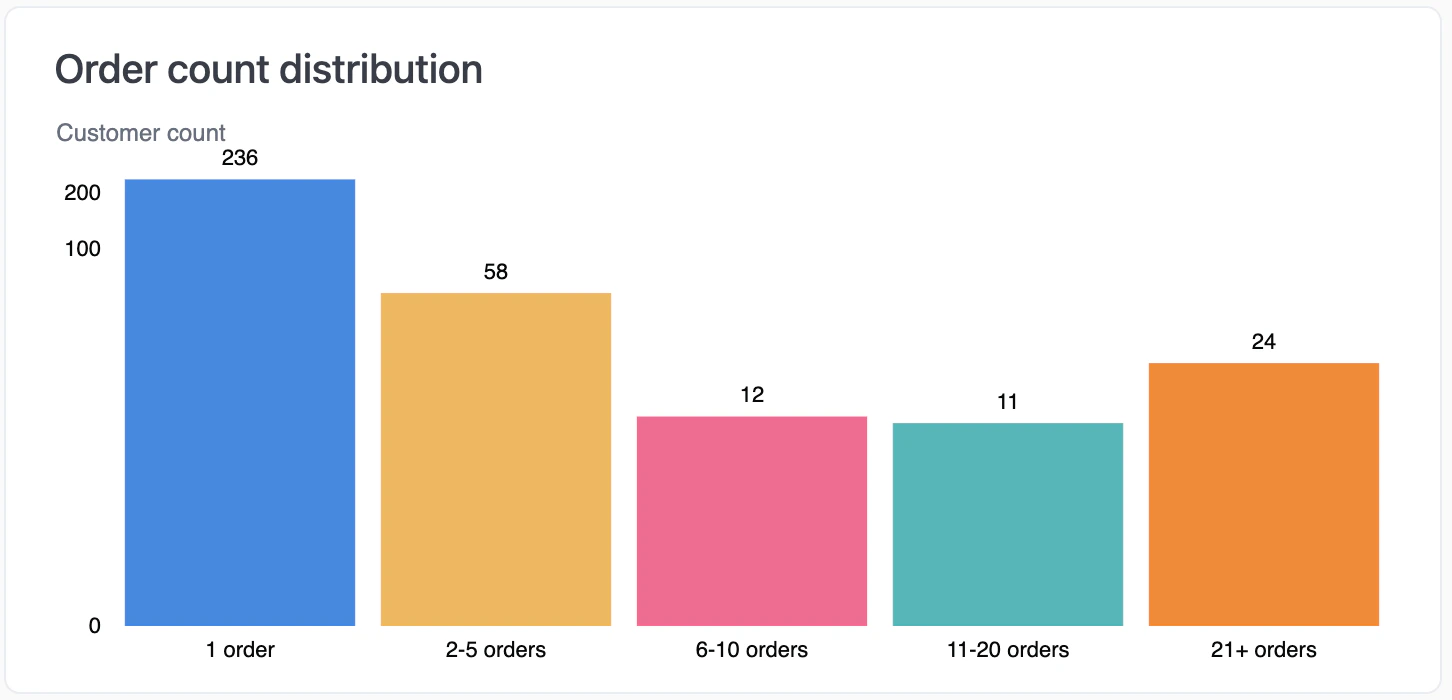 How many orders each customer has placed. Most businesses have a large "1 order" segment—the goal is to convert these to repeat buyers.
### Customer growth rate
How many orders each customer has placed. Most businesses have a large "1 order" segment—the goal is to convert these to repeat buyers.
### Customer growth rate
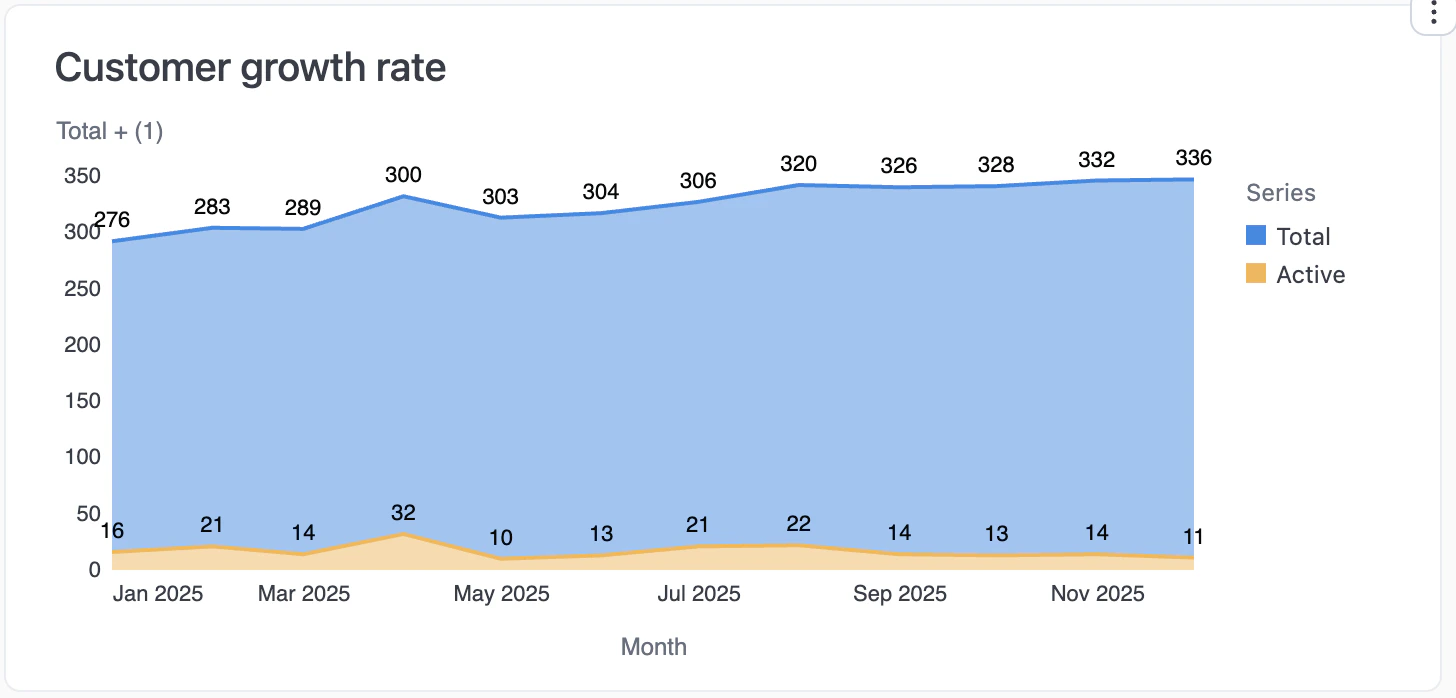 Total and active customer counts over time. Blue area shows total cumulative customers, orange area shows active customers.
### Lifetime value distribution
Total and active customer counts over time. Blue area shows total cumulative customers, orange area shows active customers.
### Lifetime value distribution
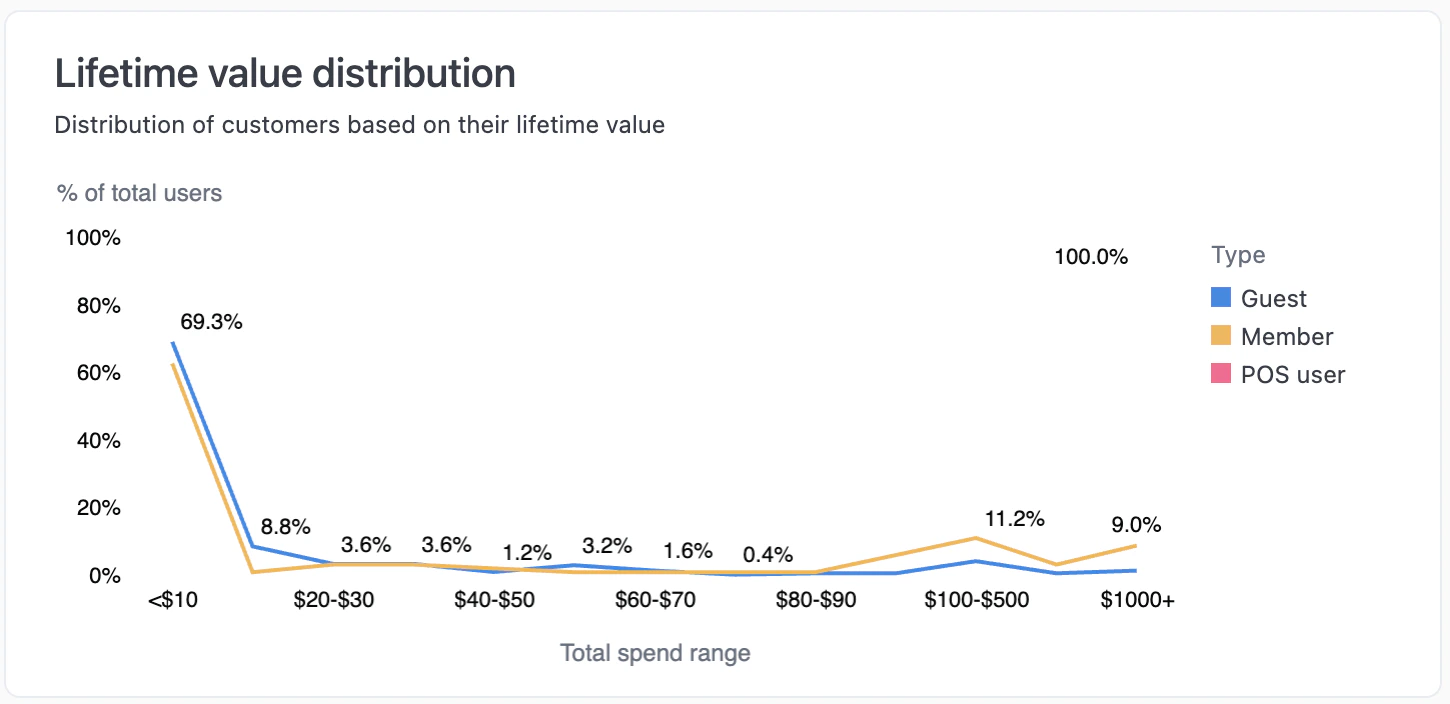 Distribution of customers by total spend, broken down by customer type (Guest, Member, POS user).
### Retention cohort analysis
Distribution of customers by total spend, broken down by customer type (Guest, Member, POS user).
### Retention cohort analysis
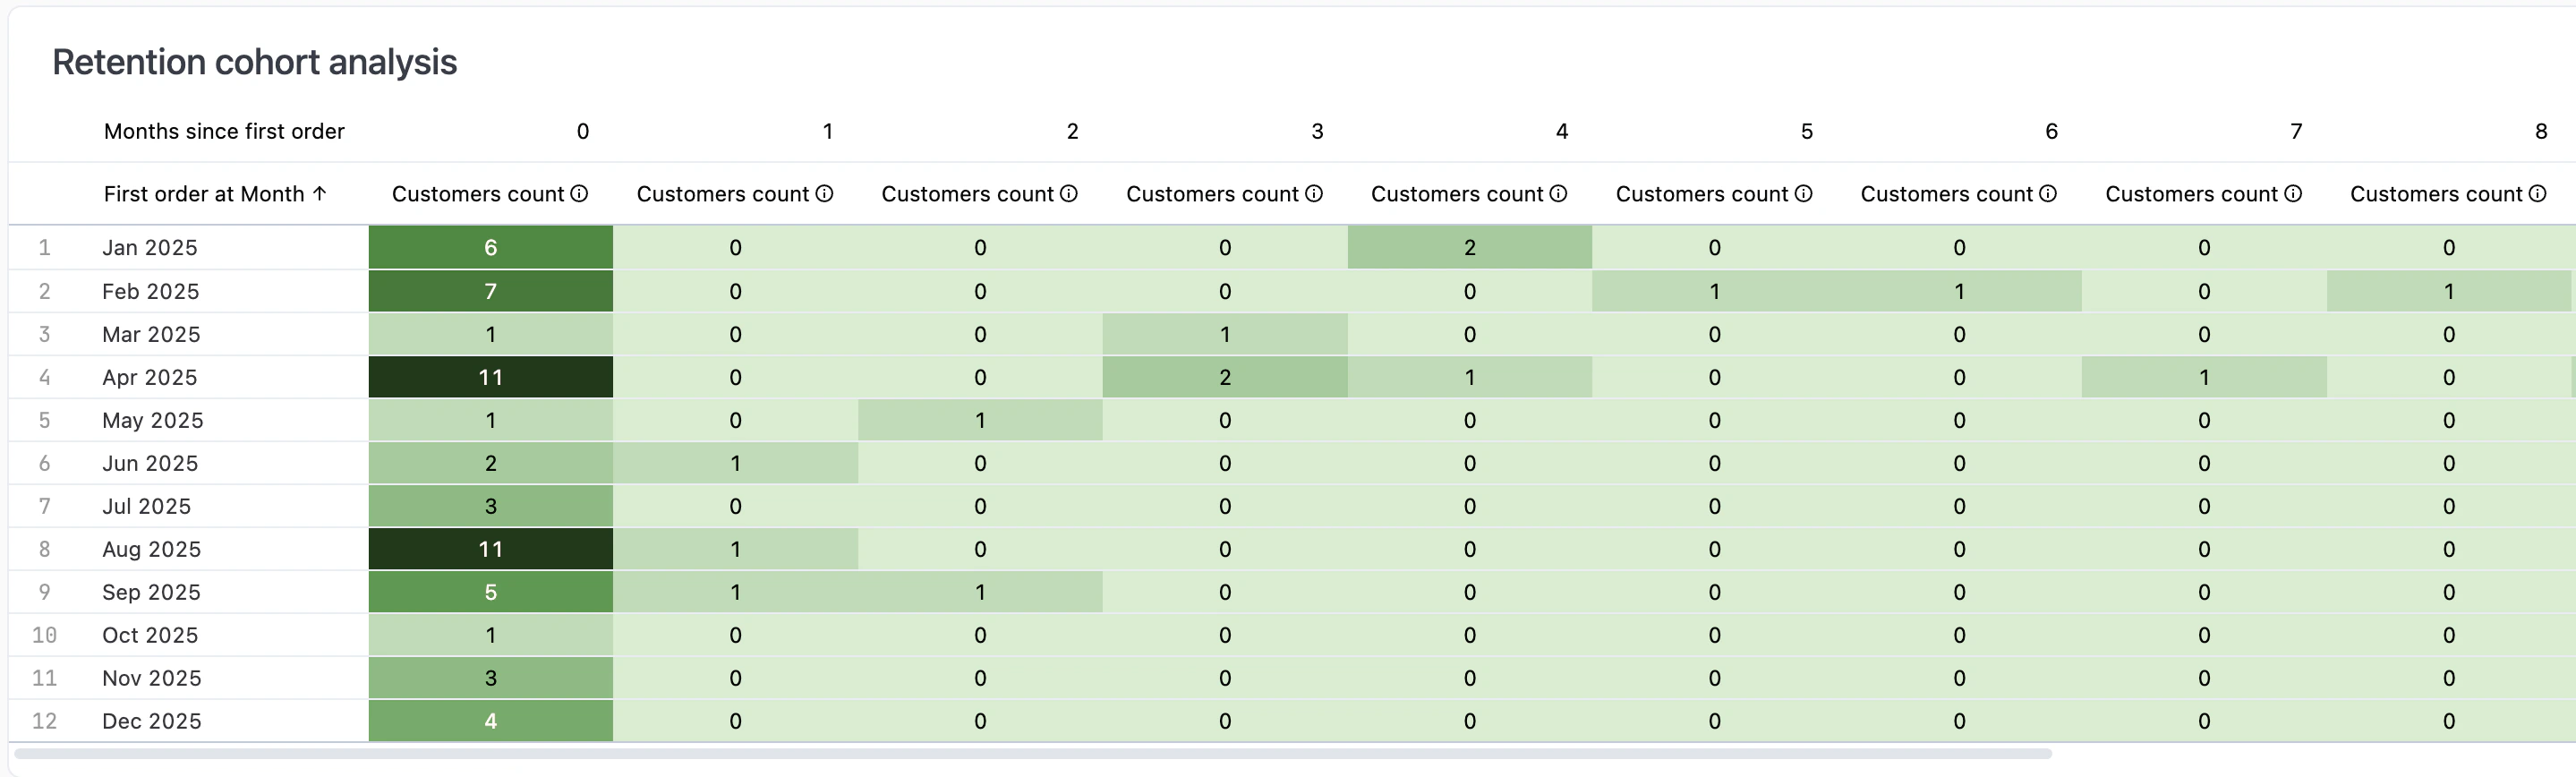 Track how well you retain customers over time. Rows show when customers first ordered, columns show how many remained active in subsequent months. Darker green indicates higher retention.
### Average order value distribution
Track how well you retain customers over time. Rows show when customers first ordered, columns show how many remained active in subsequent months. Darker green indicates higher retention.
### Average order value distribution
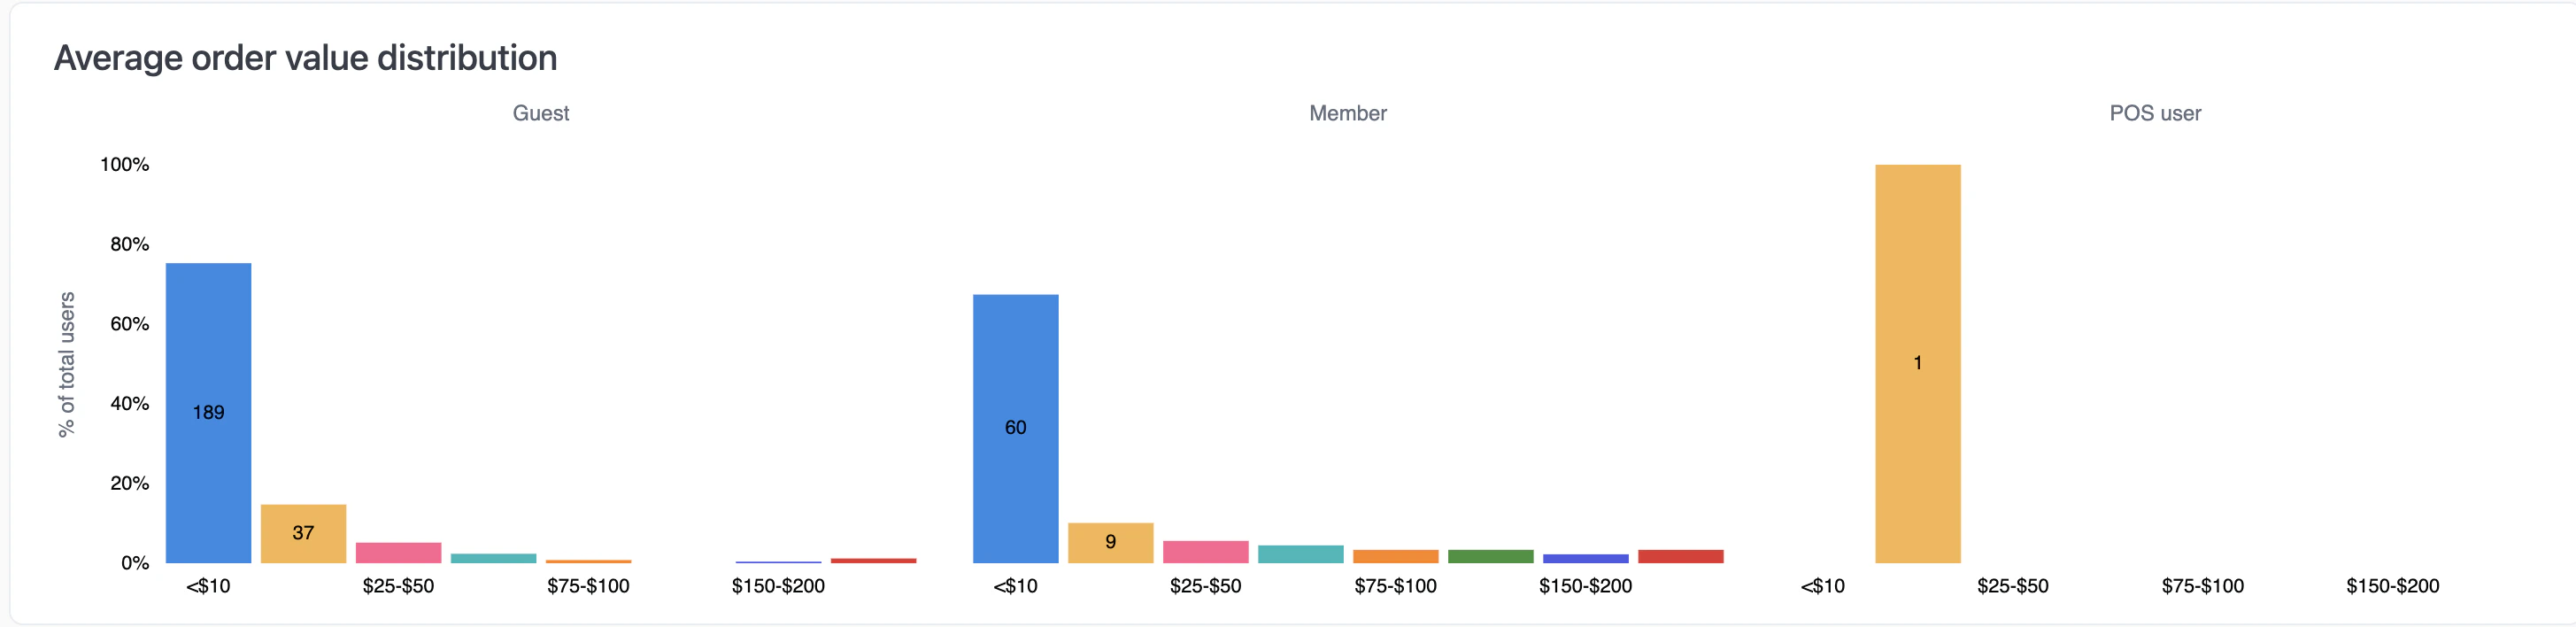 Distribution of customers by their average order value, broken down by customer type.
### Signups by first order source/outlet
Where your customers come from and how well each channel converts to signups.
### Top 100 customers
Distribution of customers by their average order value, broken down by customer type.
### Signups by first order source/outlet
Where your customers come from and how well each channel converts to signups.
### Top 100 customers
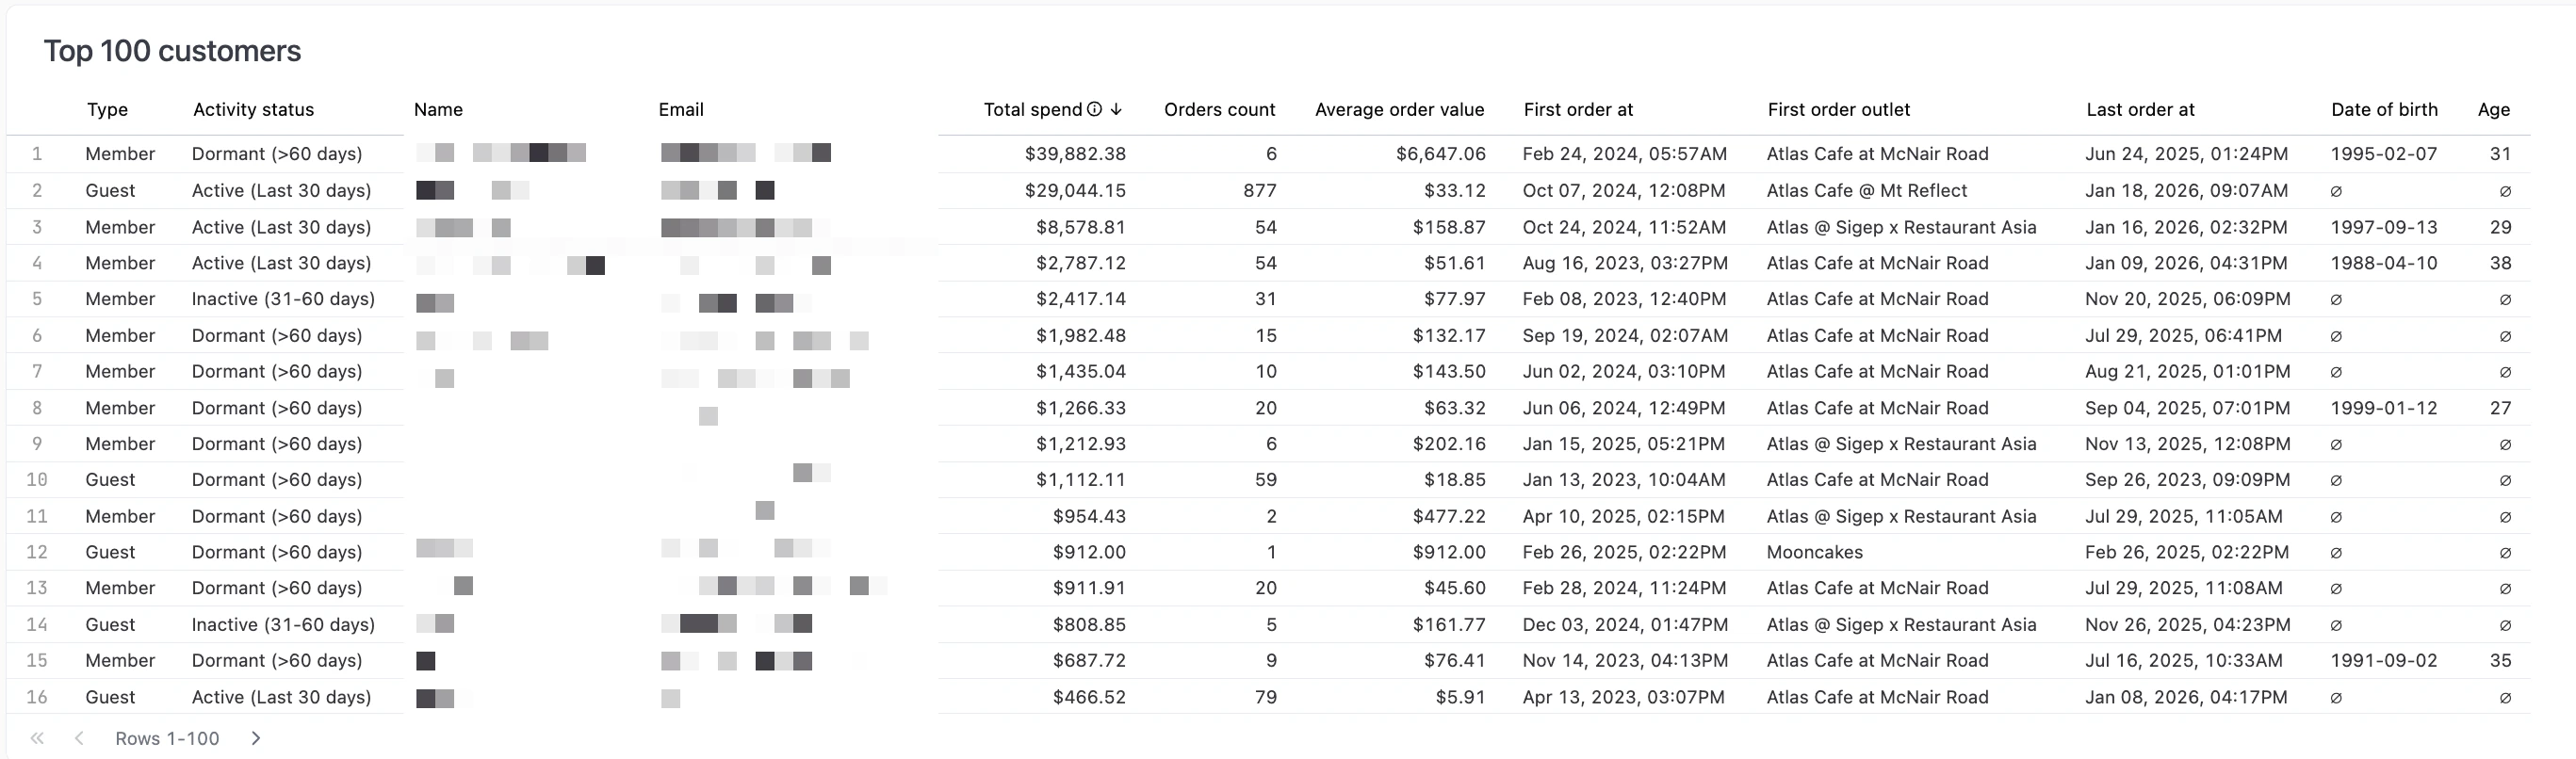 Your highest-value customers ranked by total spend.
**Columns:** Type, activity status, name, email, total spend, orders count, average order value, first order date, first order outlet, last order date, date of birth, age.
## Single customer view
Click a customer's name or email in the Top 100 customers table, then select **View customer details** to open a detailed dashboard for that customer.
Your highest-value customers ranked by total spend.
**Columns:** Type, activity status, name, email, total spend, orders count, average order value, first order date, first order outlet, last order date, date of birth, age.
## Single customer view
Click a customer's name or email in the Top 100 customers table, then select **View customer details** to open a detailed dashboard for that customer.
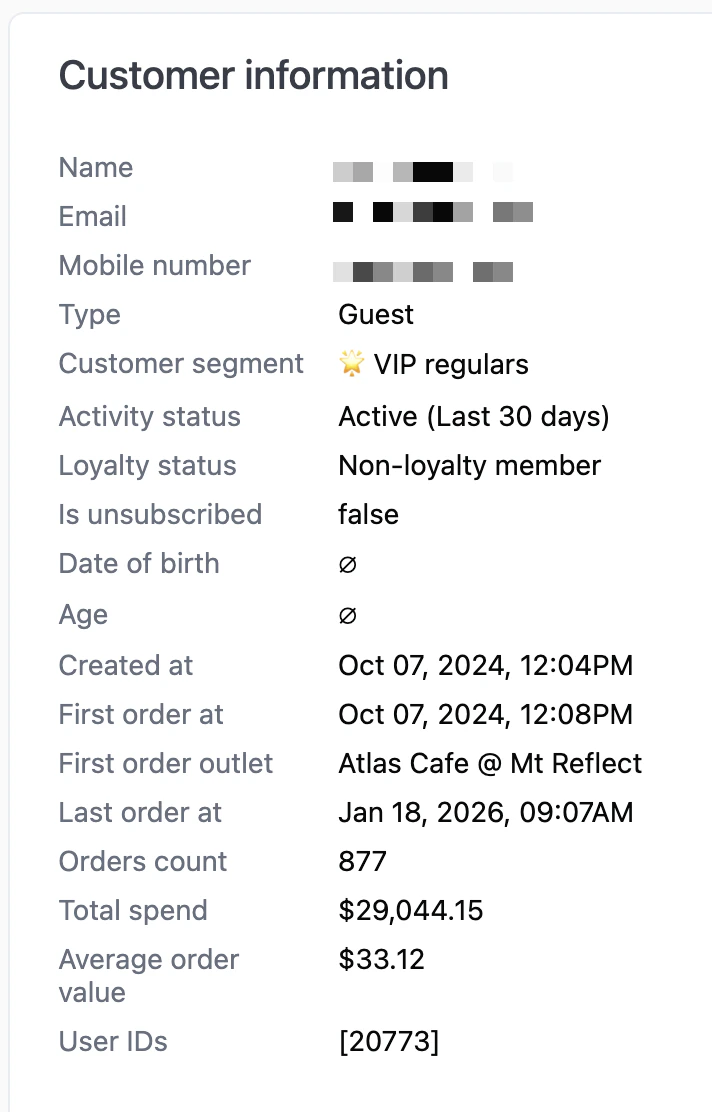 The single customer view shows:
### AI insights
The single customer view shows:
### AI insights
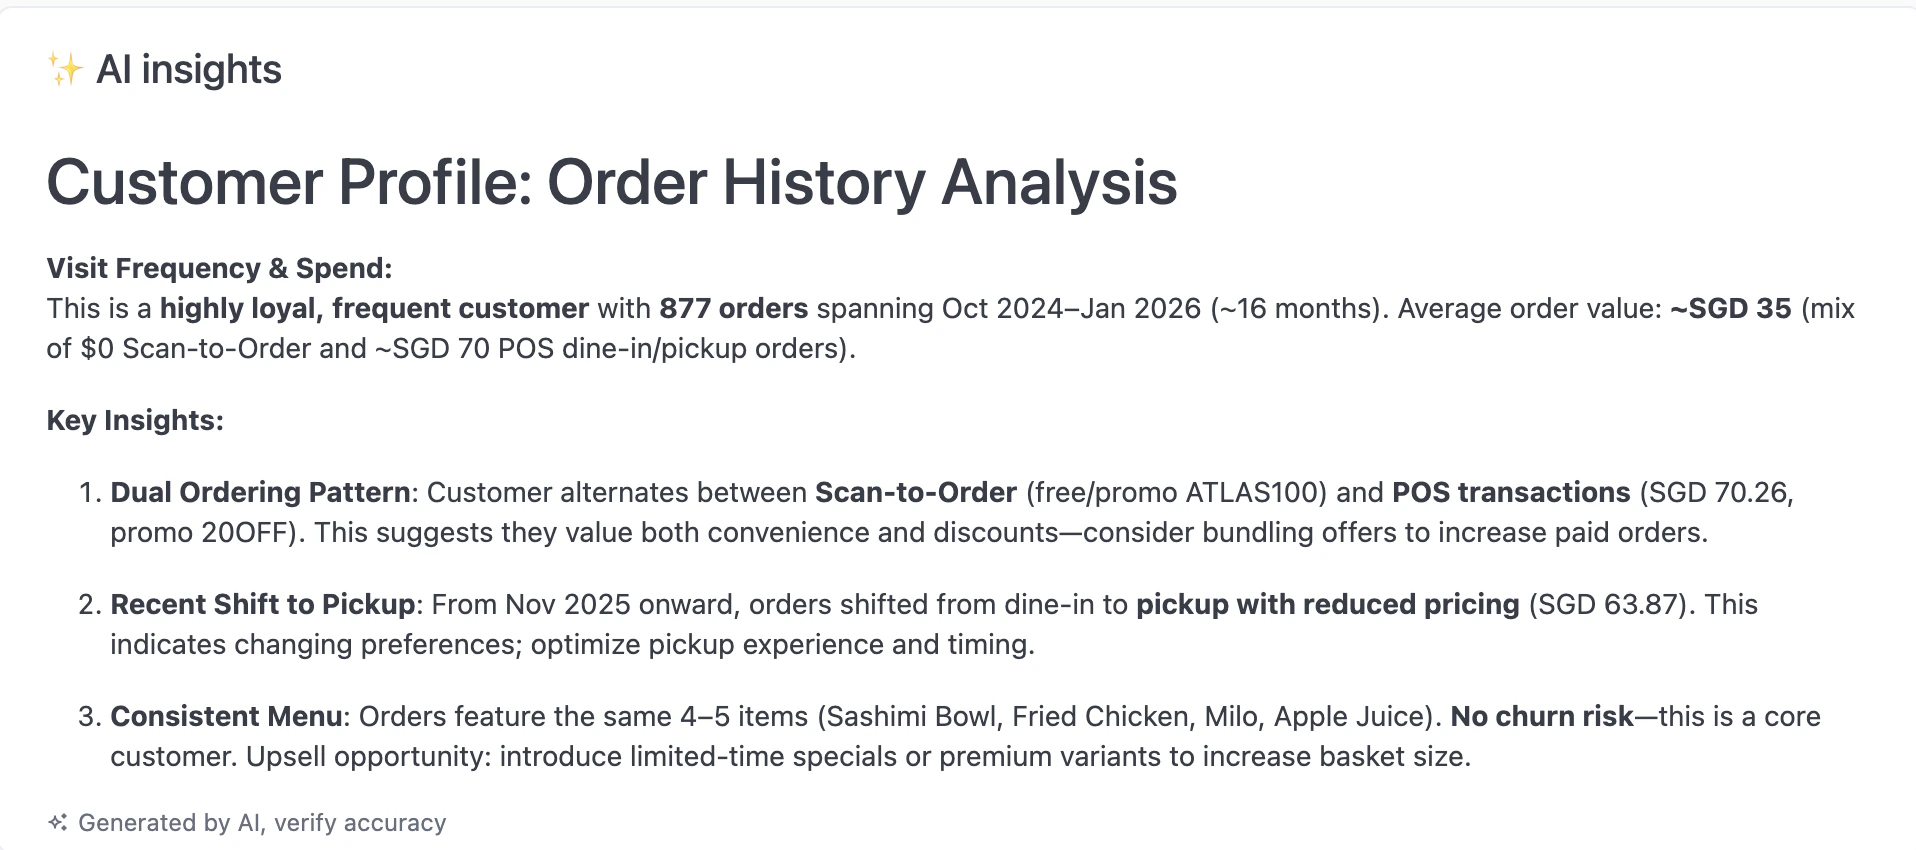 AI-generated profile analyzing the customer's visit frequency, ordering patterns, and potential opportunities.
### Order history
AI-generated profile analyzing the customer's visit frequency, ordering patterns, and potential opportunities.
### Order history
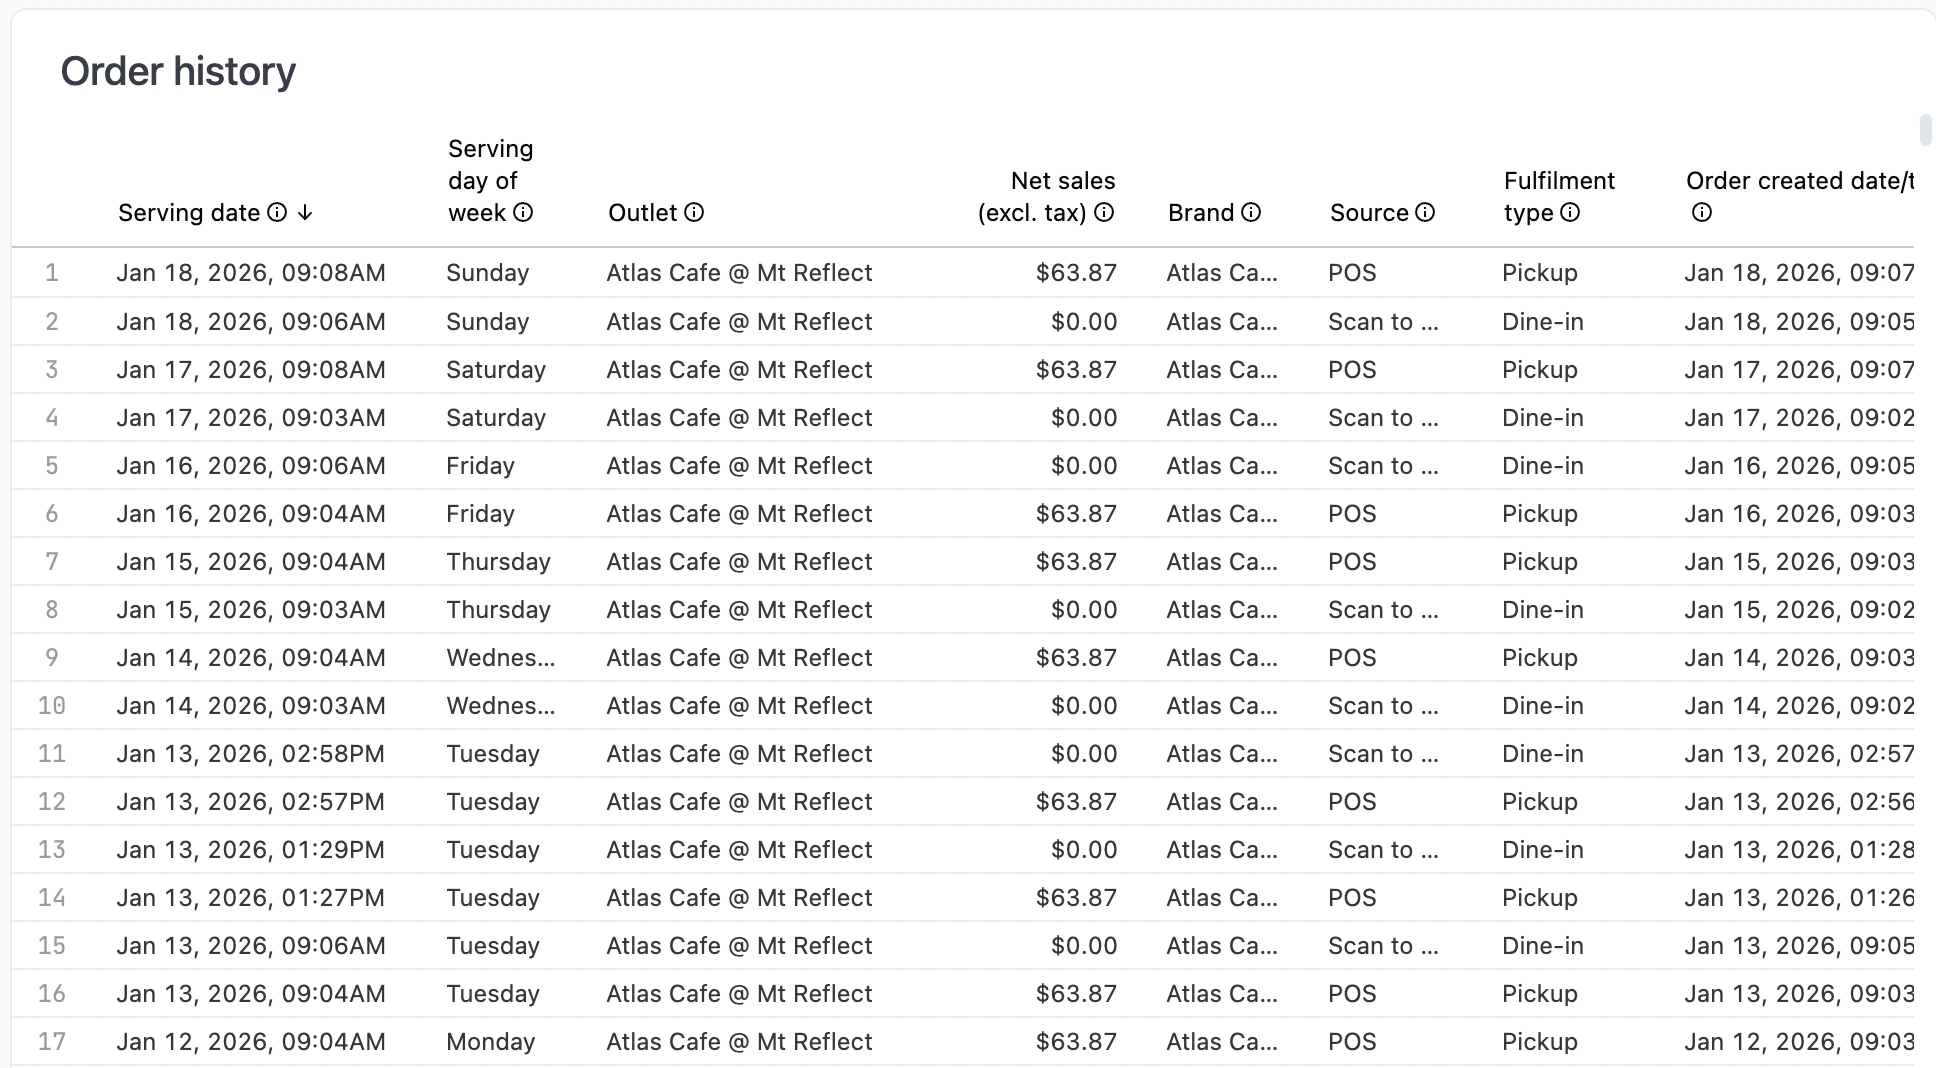 Complete order history with date, outlet, sales, source, and fulfilment type.
### Top items
Complete order history with date, outlet, sales, source, and fulfilment type.
### Top items
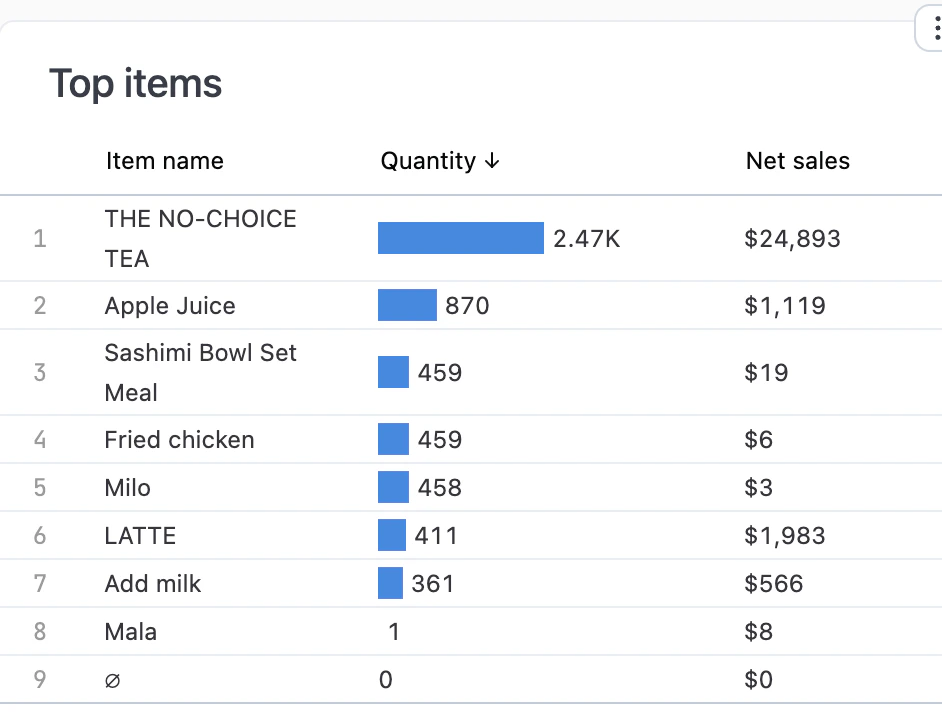 What this customer orders most frequently.
### Orders by month
What this customer orders most frequently.
### Orders by month
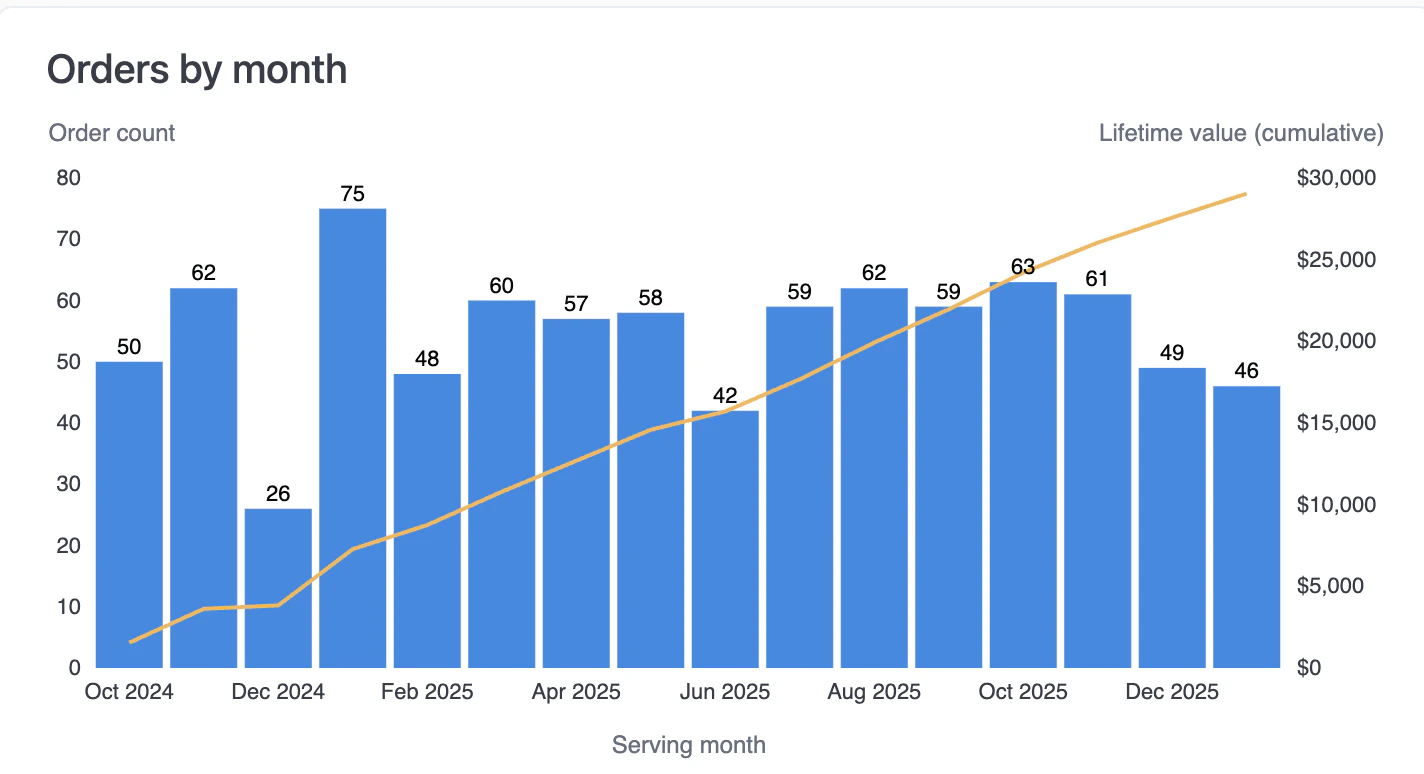 Order frequency and cumulative lifetime value over time.
### Ordering patterns
Order frequency and cumulative lifetime value over time.
### Ordering patterns
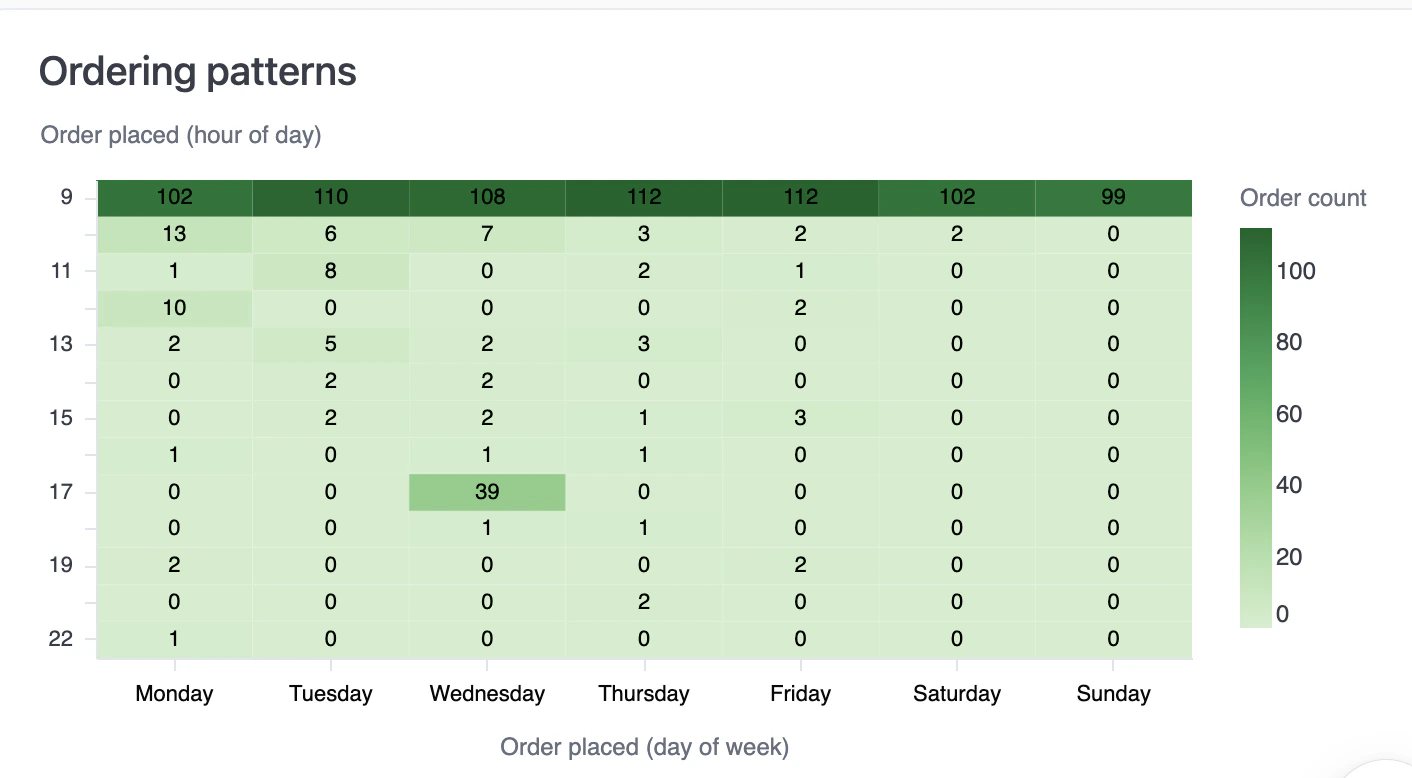 When this customer typically orders. Darker green indicates more orders at that time.
## Interactive features
* **Drill down** — Click any metric or chart to see underlying data.
* **Download** — Export data from any chart or table.
* **Copy values** — Click any metric to copy to clipboard.
* **AI assistant** — Ask questions about your data. See [Using reports](/reports/using-reports#ai-assistant).
When this customer typically orders. Darker green indicates more orders at that time.
## Interactive features
* **Drill down** — Click any metric or chart to see underlying data.
* **Download** — Export data from any chart or table.
* **Copy values** — Click any metric to copy to clipboard.
* **AI assistant** — Ask questions about your data. See [Using reports](/reports/using-reports#ai-assistant).